Exclusive Research - MOC Imbalance (Updated 2025)
If you didn’t get the chance already, read last year’s report on the end-of-day / MOC strategy
Disclaimer: This is not financial advice
Trading inherently has significant risk that is not suitable for all investors, only consider this as a single factor in your investment decision
-- THIS IS NOT RESEARCH MATERIAL --
** Restricted - External / For Internal Use Only
** These strategies are intended for institutional traders and may not be suitable for all investors
YOU MAY NOT RECIRCULATE, REDISTRIBUTE OR PUBLISH THE ANALYSIS AND PRESENTATION FROM THIRD PARTY PROVIDERS WITHOUT PRIOR WRITTEN CONSENT
No part of this material may be copied, photocopied or duplicated in any form by any means or redistributed for profit with zero tolerance
How the strategy performed this year:
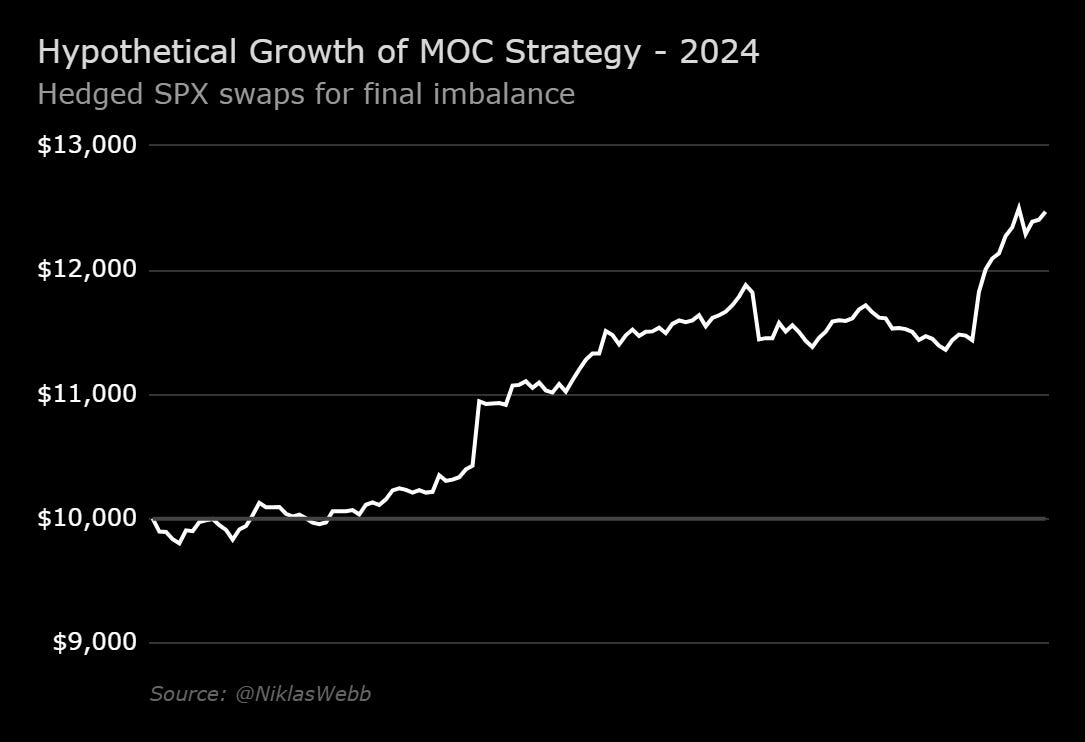
In 2024, the strategy, as detailed in the report from January last year, returned 25%, in-line with the S&P 500. The max downside of the strategy was 3.0% vs 8.5% for the index; essentially more for less.
The strategy remains fundamentally the same, with a few adjustments this year to improve efficiency:
SPX leveraged swaps (long/short)
Final imbalance (15:50)
Whereas previously imbalances as early as 15:30 were available, these were factored out this year
More research on preliminary imbalance indicators is being done to determine if they have any significance
Imbalance of any size
Previously, I only recommended trades with imbalances larger than 1.5B
Now, imbalances of any size are treated as a directional indicator
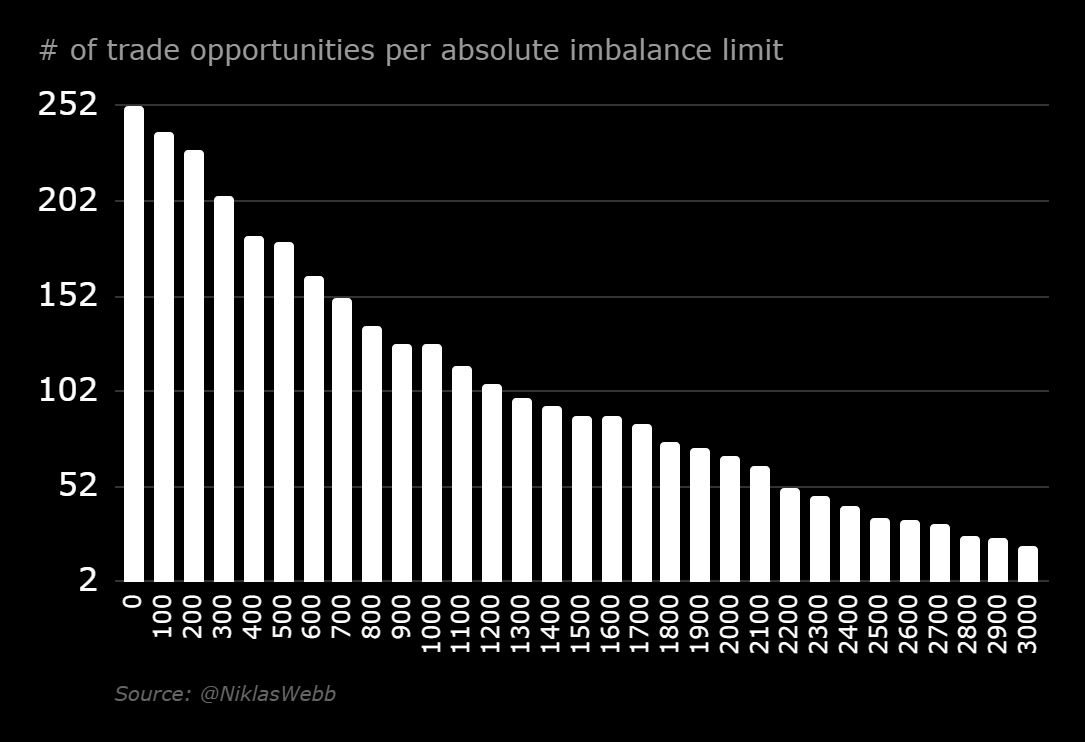
Further evidence shows there is a choice between certainty (a function of absolute, notional size) and diversity (more trades with less probability)
More trades with less probability (diversity) is favoured over higher accuracy based on size (certainty), explained in better detail below
A risk based approach using the size of the imbalance is the most optimal solution, but the hardest to manage
Options are still the wrong way to trade the imbalance:
Options remain the worst way to trade the imbalance, with a complete loss this past year.
As recommended before, do NOT attempt to trade the imbalance using short dated options. This has never been a recommended strategy and continues to be unprofitable. Even using longer-dated options still saw a loss more than -50%.
Quantity over Quality
Previously, only market imbalances larger than 1.5 billion were considered actionable, as they provided a strong and reliable directional indicator. This approach prioritized certainty, focusing on fewer trades with higher probabilities of success based on the substantial size of the imbalance. However, this method limited the number of trading opportunities, as large imbalances occur less frequently.
The updated strategy now treats imbalances of any size as valuable directional indicators. This shift reflects a preference for diversity over certainty, emphasizing a broader range of trading opportunities. By engaging in more trades, even those with smaller imbalances and lower individual probabilities, the strategy aims to capitalize on the aggregate outcomes of multiple trades. This approach allows for greater flexibility and responsiveness to market conditions.
While a risk-based approach (determining order size to be a function of the notional imbalance) is the most optimal solution, it also demands greater attention and sophisticated management. This strategy likely requires a complex, adaptive algorithm to dynamically adjust trade sizes frequently in response to varying imbalance levels, ensuring that risk is properly calibrated. Although this approach can potentially yield higher returns by leveraging significant imbalances, it’s not suitable or recommended for retail traders.
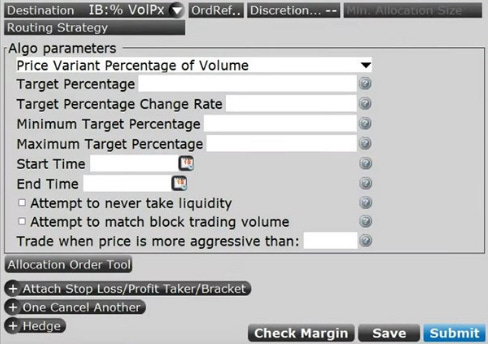
An example of a simple algorithm to handle this would be using a custom %VolPX destination which routes orders using a user-defined Price Variant algorithm, though this likely wouldn’t make a material difference in the long run. To get measurable results would require a much more complex algorithm.
Historical Imbalances
Supplemental
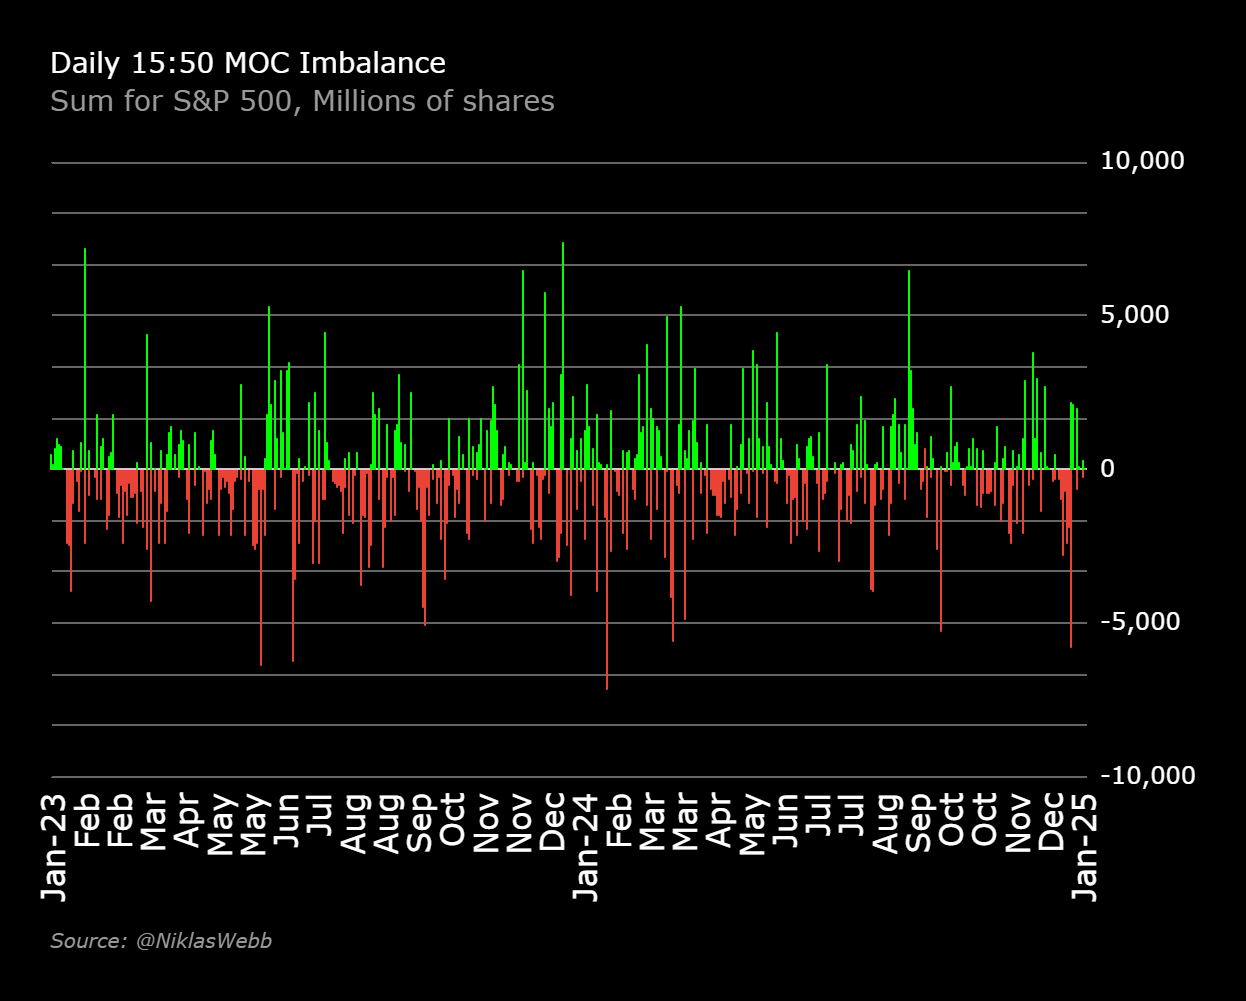
Largest imbalance - 7.4Bn buy-side (January 2nd, 2024)
Largest sell-side imbalance - 7.2Bn (January 31st, 2024)
Largest weekly cumulative imbalance - 14.582Bn sell side (May 31st, 2023)
Most volatile week - 14.6Bn (January 4th, 2024)
Largest monthly cumulative imbalance - 19.27Bn buy side (September 2024)
Most volatile month - 30.88Bn (June 2023)
Longest streak by days - 12 days sell side totalling 9.5Bn (May 17th, 2023)
Longest streak by size - 10 days sell side totalling 15.77Bn (September 28th, 2023)
Average imbalance size 1.394Bn
25%tile 0.4845Bn
Median imbalance size 1.0Bn
75%tile 2.0B
IQR 1.515b
StDev 1.299Bn
Upper outlier 2.27Bn
P(buy-side) 54.22%
P(sell-side) 45.78%
P(>=1Bn) 51.90%
Please use @NiklasWebb on Twitter as your source


