NDR: Exclusive Research - MOC Imbalance
As requested by some of Jay’s followers, here is a report about my findings on Market-on-Close imbalances and their impact on prices, market efficiency, and derived securities.
**Disclaimer: This is not financial advice, trading inherently has significant risk that is not suitable for all investors, only consider this as a single factor in your investment decision, I am not a registered security broker.
For those who don’t already know, MOC orders, or Market on Close, refers to orders in financial markets specified to be executed at best bid or offer at the close of the trading session. These orders, both buying and selling, opening and closing, are usually bundled together with other orders of the same security and paired in-house when applicable, or in block-trades on alternative trading facilities for competing brokers with inadequate client liquidity.
An imbalance occurs when there is a disparity between buy and sell orders for the same security during the closing period, which is almost guaranteed to occur. This means that for brokers to successfully fulfil all MOC orders, they must auction the remaining imbalance on the open market.
I will discuss the implications of this, identify trading strategies in equities and derivative markets, and potential downside risks too.
Implications
I first want to clarify some methodology I will be using in this research. I want to distinguish final MOC imbalance and preliminary MOC imbalance, the latter of which offers a clearer and more accurate representation. Final MOC data is reported at 3:50, when the execution process begins. However, traders without access to low-latency technology would be trading based on delayed data limited to human reaction time. For this reason, I use preliminary MOC imbalance at 15:45 (t-5min) and 15:49 (t-1min).
Secondly, I will provide two exit points; 15:55 close, and the highest bid (for sell-side days) and lowest offer (for buy-side days) during the five minutes between 15:50 and 15:55. Since I don’t believe anyone would be able to time the top perfectly, the high is only provided as a means of possible range for days where 3:55 wasn’t the perfect exit. However, I will rely heavier on the close between these times.
Finally, I will provide estimated profit on a straddle’s by DTE for any options traders interested
Size of Imbalance
Another factor to consider is the size of the imbalance. Obviously, the smaller the imbalance the lesser volatility generally assuming all else equal. This is statistically supported too (Absolute imbalance vs absolute volatility showed high correlation). There is also a high risk to rapid changes in the imbalance over the 20 minute period leading up to the execution process.
As my data would show, the average imbalance changed by 1.3Bn from 15:30 to 15:50.
This would suggest that to be certain the direction of imbalance doesn’t flip (the most common reason trades were unsuccessful in the spot strategy), it’s best to avoid any imbalance in this range.
It’s also noteworthy that the median average absolute imbalance was 1.25Bn.
With these two factors, the first condition should be
Consider trades only when absolute imbalance is more than 1.5Bn
Because I ran most of my back tests before adding this condition, some of the data will be provided for both imbalance of any size and only when greater than 1,500M.
Correlation
So, with this being said, what is the actual impact of a MOC imbalance on an all else market?
As my data would show, surprising low although some does exist. On a scale of 0-1 (Pearson’s coeff sqrd), the correlation for imbalances of all size and SPY is relatively low. The same can be told about win rate which is less than half. Additionally, the cumulative returns of this strategy of the period of a year (2023) were negative.
However, applying our 1.5Bn threshold here again, we can see improvements across all statistics (coefficient improved 10%, win rate up 8%, cumulative return greater or same)
For traders looking to be more conservative, I found that an 80% correlation is achieved above an absolute imbalance of 3Bn. Even more intriguing though is that the win rate plummets above a 3Bn imbalance, possibly because of less instances. Nevertheless, cumulative profit is highest on a >3Bn imbalance.
Identifying Trading Strategies
As explained earlier, I used two exit plans when developing this strategy; time based (3:55) and max drawdown/runup (between 3:50-55). For purposes of simplification, I am only going to assume a hard exit at 3:55 since it’s impossible to time the market. More on max runup shortly.
On the other hand, for entering the strategy, I’ve provided two entry points; 1) 3:55 (t-10min) and 2) 3:50 (t-5min)
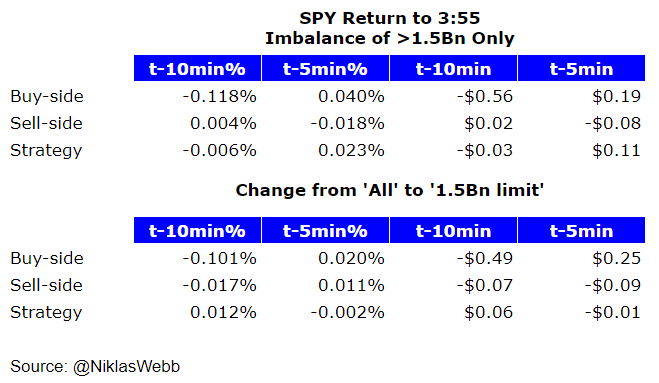
Those results show that buying too early into preliminary data without final results returned a loss, while trading based on final data at 3:50 returned the inverse in profit.
Once again though, I wanted to apply the >1.5Bn condition, and the results were slightly more promising. Again, even as the 1.5Bn threshold is designed to limit unwanted, rapid changes in the imbalance, there was still a net cumulative loss for traders making decisions based on preliminary data. On the other hand, the t-5min entry point profitability actually decreased. However, I show this likely to be an anomaly and would recommend logic over statistics here.
Therefore, assuming an average gain of 0.025% per trade on spot SPY, that consists with a 0.5% cumulative return per month. Of course, this is without the use of any leveraged instruments. It’s important to remember that this figure is net and this strategies intentions are to have a higher win rate than average true range.
Only trade based on final imbalance at 3:50
I also pointed out that the exit point is a hard 15:55. However, based on the max profit between 15:50-55, nearly half of all loser trades in the t-5min entry plan were a result of ‘not taking profit’. Again, the market is not predictable and I advise against relying on this heavier than the hard deadline exit point, but this would show win rate improved to 78%. This would also require strict monitoring of order flow during the holding period. If this is achievable, then it’s reasonable to assume this possible.
Leverage
Since the nature of this strategy is to profit from small moves in price with relatively high certainty, it would be impossible to outperform any major indexes without the use of some leverage. To accomplish this, I first back tested the strategy on 0DTE options. It’s important to note this is the only viable option since any longer expiration’s have too costly premiums to make a reasonable profit on a straddle. Of course it is possible to just trade directionally here but with a win rate of 80%, you would need to make more than 25% on every winner for every one loser (assuming total loss). While this is possible with highly leveraged options expiring in minutes, it’s not recommended for more risk adverse traders.
Since capital requirement was the biggest issue, I also back tested condor and butterfly strategies. However, ranges were too tight considering premiums and commission, and without a certain degree of price change, volatility arbitrage is not a viable option in the long run. With this being said, assuming you made directional picks on 0DTE contracts with a 80% win rate and averaged 26% returns, you could expect a 20% monthly return.
Again though, this is not suitable for the long run, and any less of an average return or lower win rate would make this strategy unprofitable.
Other leveraged instruments
With options seemingly not a good choice, I took time to consider other routes of leveraging the trade that aren’t range bound and preferably with longer duration to improve win rate. With this, I concluded swaps were the best choice.
When back tested, a leveraged swap on SPX returned a net 2% cumulatively per month. While this may not sound attractive, this still outperforms most major indexes on an annualised basis, has no duration risk (except for negative delta swaps, still considerably lower), and is relatively easy on capital requirements and liquidity.
If an annual return of 24% still isn’t enough for you, I would recommend trading directionally the inverse on VX futures. While this adds additionally unnecessary risk, it would also provide leverage and longer duration. This strategy could return anywhere from 3-5% per month, or 36-60% annually.
Lean towards directional trades with longest duration (From lowest risk to highest: SPX Rollover Swaps, VX Futures Inverted, 0DTE ATM Options)
Conclusion
In conclusion of the rules for this strategy:
Trade based on final imbalance at 15:50
Only trade when absolute imbalance is greater than 1,500
Leverage
0DTE ATM Options if monitoring order flow is achievable
VX Futures inverted
SPX Rolling Swaps
Other downside risks
With all of this covered, I wanted to explain one other factor to MOC Imbalance trading which limits directional moves up and down and gives insight into where to place the limit order to exit. This particularly applies if you’re interested in trading this strategy using options.
The order book will show any possible front running by sell-side institutions which isn’t uncommon and is actually usually placed in the form of a large liquidity wall to absorb excess imbalance and prevent large, volatile moves into the close.
Knowing where this liquidity shelf is placed is important to know the range and where to place a limit to close.
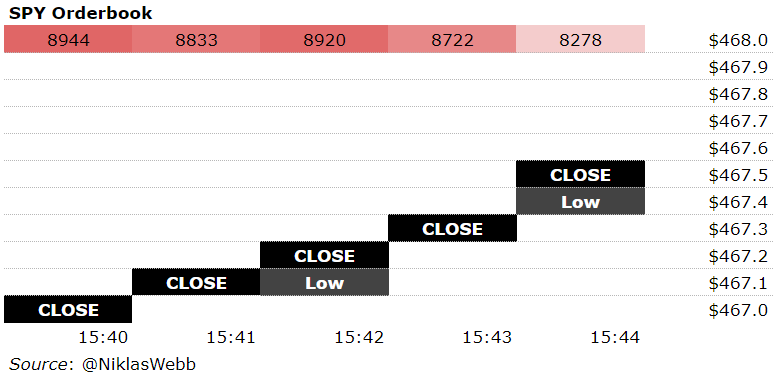
I wanted to bring up a specific example that may have confused some of you in Jay’s live stream Friday afternoon where the imbalance breakout was unsuccessful because of a large ice berg order absorbing the imbalance. This is a result of front running.
In this graphic of SPY’s order book leading into the close, notice the large quantity of shares offered at 468
As SPY pushes higher into the close due to the imbalance, it becomes limited below 468 due to the liquidity wall.
Here, you can see SPY bouncing off of 468 until it breaks through at 15:54 and the increased volume starting at 15:49.
Here on the ES order book you can notice a similar liquidity wall appear and steadily get bigger leading into 15:50.
Hopefully this provides a clearer explanation into the risks of large liquidity walls and front running, and effectively determining a take profit.


