


Morgan Stanley: From the Global Director of Research, Charts That Caught My Eye
With that mission in mind, these charts in our recently published research stood out to me.
Tech Diffusion - Edge AI: We expect Apple Intelligence to be the catalyst for a record smartphone upgrade cycle; AAPL is our new Top Pick in US IT Hardware.
Cross-Asset Strategy: We think a portfolio with a higher equity mix could offer a better risk / reward profile than a 60/40 mix longer term, as Tech Diffusion and the Energy Transition could unlink growth and inflation.
US Equity Strategy: We maintain our preference for Quality Growth Large-Caps; among small caps, we add a new preference for Growth over Value.
US Credit Strategy: We think credit is not as rich as absolute index spreads might imply because the indices have changed over time - duration is shorter and ratings quality is higher.
Alternative Asset Managers: Allocations to private assets should continue to grow.
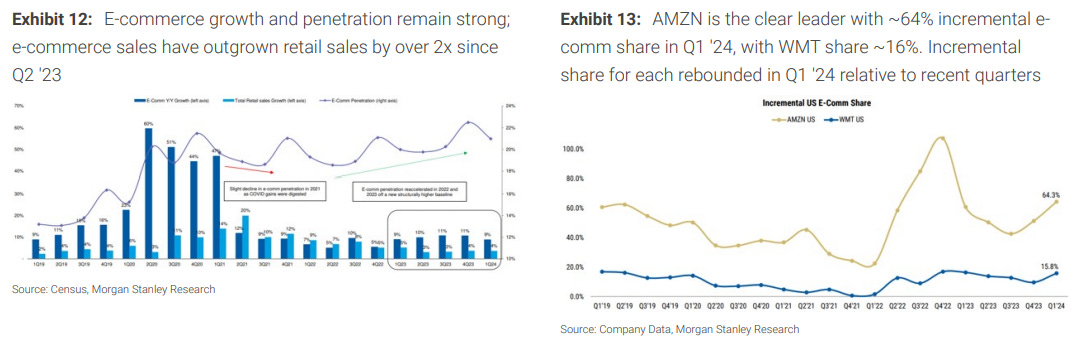
US Retail and E-Commerce: Our model suggests that Amazon and Walmart took a combined ~80% of Incremental E-commerce share gains from traditional retail.
Global Tech: CIOs' tech budget expectations continue to rise, and AI / ML is an even greater priority, but expected deployments of AI projects are being pushed out to the right.
Japan Strategy: Yen weakness should continue to support the overall equity market, including offering room for upward earnings estimate revisions by companies with favorable exposure to a weak yen.
Please reach out to me with feedback on these or any other key investment debates. Thank you for your partnership.
Katy Huberty
Global Director of Research
Tech Diffusion - Edge AI
Apple Intelligence Likely to Be the Catalyst for a Record Smartphone Upgrade Cycle
Our Global Tech team believes the “AI Smartphone Era” will kick off in 2H24 with the official launch of Apple Intelligence. They expect the launch to significantly accelerate Edge AI development in smartphones and spur development of more killer apps — historically emerging only 1-2 years after an initial tech breakthrough — which should accelerate AI smartphone penetration. Our team now forecasts iPhone replacement cycles will shorten by 0.1 years Y/Y in FY25 to 4.7 years and another 0.3 years Y/Y in FY26, to 4.4. Our US Tech team views this as very bullish for Apple — historically, AAPL shares have outperformed when replacement cycles contract — and they make Apple (AAPL.O. US$231, Overweight) their new Top Pick in US IT Hardware. Our Global Smartphone analysts’ rank of preference is Apple > Apple supply chain > Android smartphone OEMs > Android supply chain.

Cross-Asset Strategy
The Future of the 60/40 Portfolio
Our Global Cross-Asset Strategy team notes that a 60/40 equity/bond portfolio worked well for decades… until it didn't. They believe that higher stock-bond correlation, elevated Treasury volatility, and poor government bond returns have diminished the effectiveness of fixed income as a portfolio diversifier. But they think that there's still value for 60/40-type strategies because they believe bonds remain a good diversifier, even if the “ideal” mix needs a rethink. They think a portfolio with more equity could offer a better risk / reward profile than a 60/40 mix. Longer term, they believe that positive productivity shocks from GenAI Tech Diffusion and the Energy Transition could unlink growth and inflation, while decoupling in key economic regions could alter correlations between regional equities and rates. On the other hand, they note that an aging population’s greater longevity might demand higher allocations to a less volatile asset, even one with lower returns.

US Equity Strategy
Maintain Our Preference for Quality Growth Large-Caps; Among Small Caps, Adding Preference for Growth over Value
Our US Equity Strategists note that the Fed typically cuts rates as nominal growth slows, and that past such regimes have seen the market pay up for Quality and Secular Growth attributes. Hence, they continue to recommend Large-Cap Quality and Growth. But within the Small-Cap cohort, they are now making a nuanced relative call — long Growth over Value. Longer-duration Small Caps that are growth-oriented and more sensitive to changes in their cost of capital have benefitted on a relative basis as yields have come down, while the Small Caps that are more economically sensitive (i.e., Value) have not benefitted. They believe this trade has more relative upside to go as earnings revisions are supportive of small cap growth, and history shows that Small Cap Growth typically outperforms when the Fed begins cutting rates. Further, the Biotech industry has the largest weight in the Russell 2000 Small Cap Growth Index, and our team’s work has shown that Biotech has a strong relative performance track record post the start of Fed rate cuts.

Less Rich than You Think
Although credit spreads are near prior cycle tights, our Fixed Income Strategists argue that credit is not as rich as index spreads might imply because the indices have changed over time, impacting historical comparisons — duration is now shorter, dollar prices are lower, and ratings quality is either better (for the High Yield index) or improving (for the Investment Grade index). After accounting for these differences, they estimate "adjusted" IG spreads are still 15-30bp off the levels hit in prior tights. Although HY spreads appear richer than IG, when they factor in index composition changes, spreads are 20-60bp off prior period tights, on our team’s estimates. Our Strategists forecast that HY spreads will hold near current levels and IG spreads will move marginally tighter.

Alternative Asset Managers
Allocations to Private Assets Should Continue to Grow
Our Global Financials team has long argued that we are in a “Golden Age of Private Markets” that should continue to provide strong secular support to Alternative Asset Managers, helping drive a ~10% CAGR in fee-paying Assets Under Management over the coming 5 years. Our Europe Financials team’s recent meetings in the US with industry experts reinforced their conviction in Alts’ growth of assets from wealthy clients. Further, allocation intentions from recent surveys of wealth advisors and institutional clients point to growing interest in private assets. For example, they highlight a recent survey of institutional investors that indicates intentions to increase allocations to private assets over the next 2 years, with private credit and private equity most popular.

US eCommerce
Amazon and Walmart Took a Combined ~80% of Incremental E-Commerce Share Gain
Our US Retail and Internet analysts’ updated “E-Commerce Funnel” model indicates that in 1Q24, E-comm sales grew ~9% Y/Y vs. total retail sales growing ~4% Y/Y, with E-Comm penetration of ~21% up ~100bps Y/Y. They highlight that within that share gain, Amazon.com is the clear leader. Amazon took ~64% incremental share in 1Q24 (+300bps vs 1Q23), reinforcing the idea that the big are getting bigger at an accelerating rate. Walmart was the next-closest incremental share gainer at ~16% in 1Q24, which represents an upward inflection from 4Q23. Our analysts rate both Walmart (WMT.N, US$69) and Amazon (AMZN.O, US$194) Overweight, and AMZN is our US Internet analysts’ Top Pick.
Global Technology
2Q CIO Survey – Stable Budgets, Nervous CIOs
In our Tech team’s latest AlphaWise survey of corporate Chief Information Officers in the US and Europe, respondents on average expect overall IT spending growth of +3.5% Y/Y in 2024, up +64 bps from +2.9% in 2023 and up +29 bps from the 3.2% in the 1Q24 survey. While that puts budgets firmly in growth territory, growth expectations remain below the long-run pre-Covid average of +4.1%. Net prioritization of AI/ML continues to increase, rising +267 bps from the 1Q survey. However, CIOs’ confidence in the timing of their use cases reaching production softened: 2Q24 data indicates a push-out in CIOs' expectations for GenAI projects to enter production, with 26% of CIOs expecting first projects to enter production after 2025, an uptick from 19% of CIOs over our past two surveys.

Japan Strategy
Yen Weakness Continues to Support Japan’s Equities
Our Currency Strategists note that the USD/JPY rate has continued to diverge further from the “fair value” implied by market pricing of the Fed’s rate cut trajectory. Their explanatory variables do not rationalize why this might be happening. Our Japan Equity Strategists estimate that a 1% yen depreciation vs USD should lift TOPIX by 0.5%, all else equal. Additionally, they note that the current USD/JPY rate is far higher than companies' assumptions, which could lead globally exposed beneficiaries of yen weakness to raise guidance.
