


Morgan Stanley: August 2024 Hedge Fund Recap (09/05/2024)
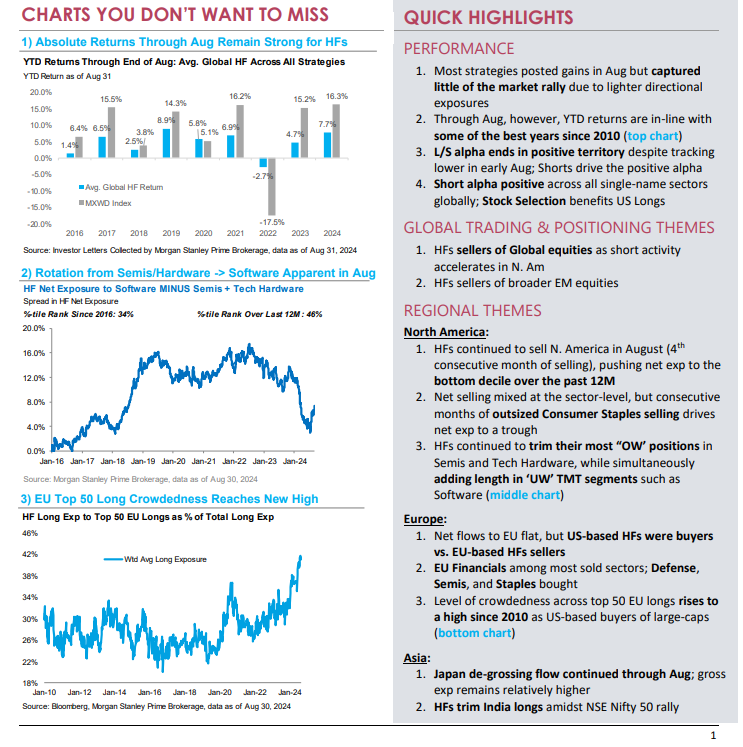
Following a challenging start to the month which saw most major strategies down ~2-3% through the first few days of Aug, most strategies recovered to post gains last month. L/S alpha had also deteriorated early in the month but improved by month-end to finish in positive territory due to shorts appreciating less than benchmark indices. With four months left in the year, HFs are poised for one of their stronger years in absolute terms – YTD gains through Aug of +7.7% are among the highest we’ve seen in any calendar year in the past decade (only year that was better was 2019 when HFs were +8.9% through Aug).
Quick highlights for August:
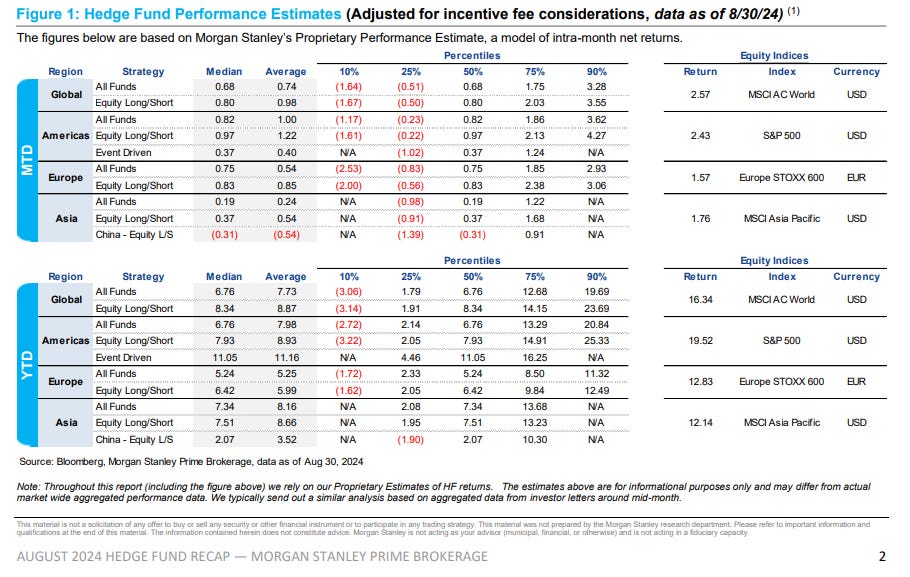
Based on our MS Proprietary Estimates (Figure 1):
As HFs took down their directional exp to equities in the tail-end of July / early Aug, most strategies captured a slightly smaller fraction of the upside in equity indices vs. what we observed earlier in the year. The average Global HF ended +0.7% for the month of Aug while Global L/S funds were +1.0%, though this compares to the MSCI AC World Index +2.6% for August. On a YTD view, the average Global HF and average Global L/S fund are now +7.7% and +8.9%, respectively (vs. MSCI +16.3%)
Americas-based HFs outperformed their regional counterparts last month, with the average fund +1.0% while the average Americas-based L/S fund was +1.2% (representing roughly half of the S&P’s gains last month). For the full year, the average Americas-HF is +8.0%, while L/S funds have outperformed as they are up closer to +9% – this all compares to the S&P +19.5% through the end of August
EU-based HFs posted gains of just over 50bps for the month of Aug, while EU-based L/S funds were up closer to 85bps (all compares to the Euro STOXX 600 Index +1.6%). EU-based HFs continue to lag their peers as the avg. fund in the region is up just +5.2% for the year – EU-based L/S funds are up slightly more at +6.0%, though that is still slightly below half of what the Euro STOXX 600 Index is up for the year
Asia-based HFs posted the smallest gains across regions, with the average fund up +0.2% and the average Asia-based L/S fund ending +0.5%; it is also worth noting that China-focused L/S funds were the only major strategy we track to post losses, with the group down ~50bps in August. For the full year, Asia-based HFs have been the strongest relative performers vs. their benchmark, with the average HF +8.2% vs. the MSCI Asia Pacific Index +12.1% YTD
YTD Returns Through Aug Historically Strong in Both Absolute and Relative Terms
Through the end of August, the average Global HF is now sitting on gains of ~7.7% on average, which when compared to prior August YTD figures, is the 2nd strongest year for absolute returns since 2010 (trailing only 2019).
Not only have absolute returns been quite strong, but when compared to other years where the MSCI was up >10% through Aug, the relative returns this year appear stronger. There have been five instances where the MSCI has rallied >10% through August since 2010, and the portion of that upside that HFs have captured is higher than 3 of the prior 4 (only 2019 was stronger). Currently, the average Global HF is capturing ~47% of the MSCI’s YTD gains.

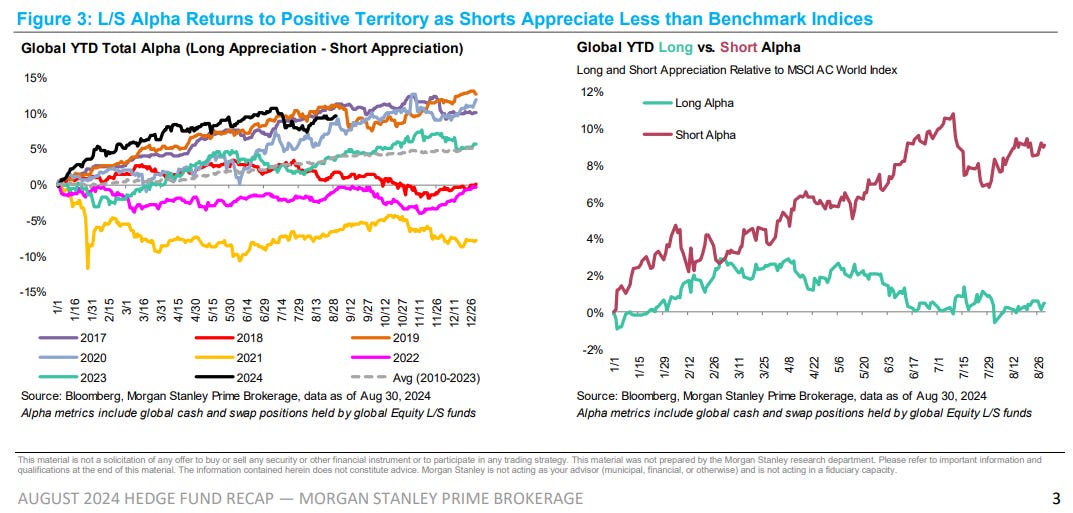
After ending in negative territory for the first time this year in July, L/S alpha returned to positive territory for the month of Aug. Longs ended the month up just over +2.3% while shorts were up +0.9% compared to the MSCI AC World Index +2.6%. Short alpha had been the primary detractor in July but ultimately drove the positive spread in Aug given they underperformed the MSCI by ~1.7% last month (long alpha ended in negative territory for the 4th time in the past 5 months). Short alpha has continued to account for most of the positive alpha L/S funds have been able to generate YTD, as longs are up only ~50bps more the MSCI vs. shorts up ~9.1% less than the MSCI.
Short Alpha Positive Across All Global Single-Name Sectors; Stock Selection Benefits Long Alpha
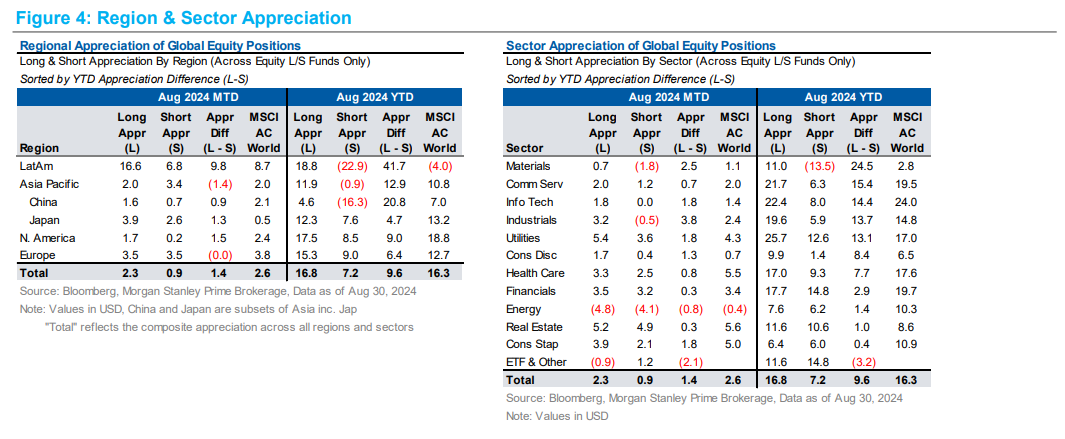
The spread between longs and shorts was strongest in LatAm in Aug, where longs outperformed shorts by nearly ~10%. The spread was also positive in N. Am and China due to shorts lagging benchmarks and was positive in Japan due to longs outperforming. The spread between longs and shorts ended flat in EU, with both longs and shorts ending +3.5% in Aug.
At the sector level, short alpha was positive across all single-name sectors whereas long alpha was more mixed. The spread between longs and shorts was most positive across Industrials, Materials, and Staples, most of which was driven by stronger short alpha in each sector. The only sector where the spread was negative was Energy as longs underperformed benchmarks.
Across US equities (assuming a 100% long vs. 50% short portfolio), Stock Selection and Style Factors were both small positive contributors to the positive alpha observed in the region. The positive Stock Selection came via HF’s long portfolios, whereas it was a detractor from short alpha. As for Style Factors, the contribution to returns was much more positive on the short side.
Diving a layer deeper into Style Factors, Momentum, Profit, and Long-Term Reversal were the largest positive contributors to L/S alpha, despite all three weighing heavily on alpha in the first few trading days of August. On the other hand, HF positioning to the Size factor, ResVol, and Beta all offset a portion of this positive alpha.

THEME #1: HFs Continue to Sell Global Equities Amidst Continued Macro Uncertainty
Amidst continued macro uncertainty and market volatility, HFs were net sellers of Global equities for the month of August across most regions as HFs short additions outpaced what was added on the long side. The bulk of the selling observed in August was driven by Multi-Strat / Macro funds who reduced directional exp to N. Am equities. In other regions, the net selling was not nearly as large, and it’s also worth noting that HFs were actually small net buyers within Asia ex-Japan.
Consistent with the net selling observed last month, the Global L/S ratio (excl. Quants) fell again MoM, tracking to near its lowest level we have seen in >12 months. The current L/S ratio sits at 2.03x as of month-end, which represents just the 7th %- tile over the last 12M and the 36th %-tile over the last 5 years.

THEME #2: HF Selling of EM Continues into August
Since the start of 2Q, HFs have been large net sellers of EM equities, though much of this had been driven by China Tech / Taiwan Semis. However, even when excluding these two countries, that same trend of net selling still holds true. In terms of where net exp to this cut of EM sits today, net exp is still in the 93rd %-tile over the last 12M and the 98th %-tile over the last 5 years, though Aug was the first month where we’ve seen net exp to EM (ex. China + Taiwan) decline MoM since March ‘24.
Most of the net selling over this period and last month has been driven by Brazil, Korea, and India. At the strategy level, MultiStrat / Macro funds have accounted for most of the net selling both in Aug and since June. At a more granular level, the selling was driven by Industrials in Brazil, TMT-related names in S. Korea, and India Financials.

THEME #1: HFs Sell N. America for 4th Consecutive Month, Driving N. Am Net Exp Lower
As mentioned above, the selling of global equities in August was predominantly concentrated in N. America, representing the 4 th consecutive month of N. Am selling and the 6th month this year (February and April were the only months where HFs bought the region). Notably, most of the selling in August occurred in the back-half of the month, as HFs trended towards buying equities in 1H August amidst the recovery in equity prices.
HFs entered the year with their net exposure to N. Am equities (as a %-tage of total Global net exp) near the highest we’d seen since early 2016, but nets have since fallen closer to the bottom decile relative to the past 12M on the back of the sustained selling throughout the year.

Looking at the flow more granularly, ETFs accounted for roughly half of what was sold in notional terms in Aug as HFs added to shorts in broad-based index-level hedges. When stripping out ETFs and looking just at the single-name flow, the magnitude of the selling last month was much lighter compared to the net selling in July (July was the largest month of single-name selling since 2022).
Breaking the flow out further, the selling in Aug was more concentrated in Staples, Materials, Tech, and Financials. The reduction in directional exp to Staples stood out the most considering net exp to Staples sat near a post-COVID peak entering ’24, but the outsized net selling in July/August has driven exposure levels to a low over the past 12M.

THEME #2: TMT Flow Mixed as HFs Begin Rotating Out of Semis/Tech Hardware and into Software
HFs continued to sell TMT last month, though when compared to other recent months where the space was net sold, the flow appeared more mixed beneath the surface. Most of the TMT net selling in August took place in Semis and Tech Hardware, further extending the pattern we’ve been observing since May/June (around the time when Semis/Hardware ownership peaked). On the contrary, the positioning setup to Software reached a bottom by July month-end, but HFs have since turned to net buyers of the trade in August. Interestingly, when looking at the spread between Software positioning vs. Semis + Hardware, we saw the divergence in ownership reach a multi-year low in June, but levels have since risen closer to medians as a result of the recent reversion in net flows.
Drilling a bit deeper into the Software buying, the renewed interest appeared to be most pronounced in Cyber Security and Software-as-a-Service names, both of which were areas where net exp sat at a trough entering August. Despite the recent inflection in net flow, net exp to most variations of Software still hover around multi-year lows, which tells us there remains a lot more room till HFs are back to a more “typical” range in terms of Software ownership.
Another reason that leads us to believe we are still in the very early innings of how much HFs could potentially buy in Software is that when comparing the portion of Discretionary L/S HF’s long portfolios invested in Software vs. Software’s weight in the Russell 3000 Index, it had narrowed to 8+ year lows as of July – at its peak, HFs long exp to Software was ~8% higher than its weight in the benchmark, but that has since narrowed to a 1% ‘OW’ position as of August month-end.
