Jefferies: A question of hoarding (09/05/2024)
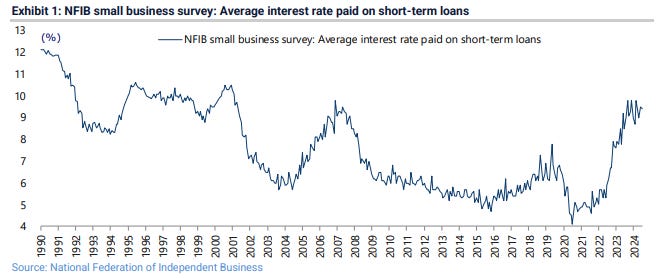
Tomorrow’s US employment data remains key to stress-test the extent of Fed easing expectations currently priced into markets. This is all the more the case as it has become ever clearer that the Fed will prioritise employment over inflation if forced to choose between the two, a point also made by Jefferies’ Chief Market Strategist, David Zervos, in a recent report (Zervos Macro Commentary: The case for a rapid return to a neutral rate structure, 30 August 2024). In this respect, an interesting issue is the extent to which so-called labour hoarding, a mindset which is the consequence of the difficulty of hiring labour coming out of the pandemic, has slowed the normal adjustment in the labour market. This should have been expected in the context of the big increase in interest rates in recent years experienced by SMEs, which employ 73% of America’s private sector employees. The average borrowing cost for small businesses in the past 12 months has been running at 9.3% (see Exhibit 1).
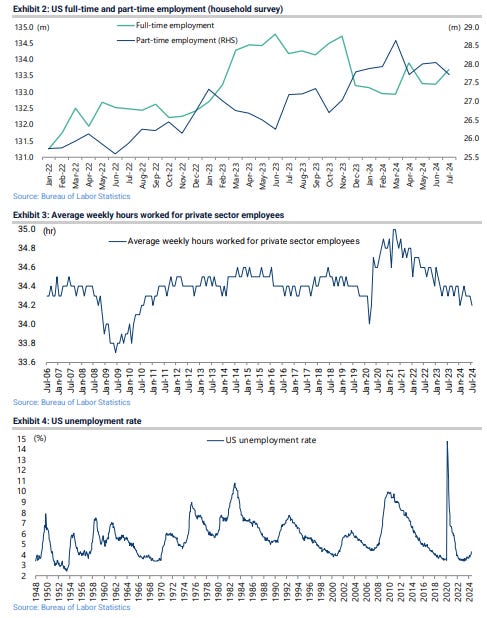
Jefferies’ US economist, Thomas Simons, continues to see evidence of such labor hoarding. He notes that businesses have preserved margins by reducing labour costs via shorter hours and resorting to part-time employment, as opposed to reducing headcount outright (see Jefferies research Jobless Claims Continue Sideways Drift, NSA Claims Fall to Lowest Since October 2023, 29 August 2024). On this point, part-time employment has risen by 1.48m from 26.25m in June 2023 to 27.73m in July 2024 while full-time employment declined by 1.1m from 134.8m to 133.7m over the same period, according to the household survey employment data (see Exhibit 2). The monthly average workweek also shows a trend towards shorter shifts and more part-time work. The average weekly hours worked for private sector employees have declined from a recent high of 35 hours in April 2021 to 34.2 hours in July, the lowest level since March 2020 (see Exhibit 3)
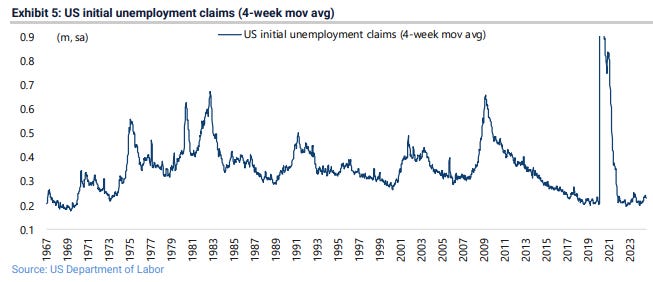
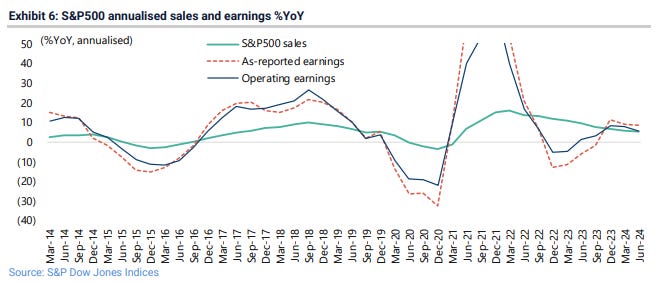
The above is of note because, historically, when the unemployment rate starts to rise, or indeed unemployment claims, both tend to rise quickly (see Exhibits 4 and 5). That raises the key issue of whether this cycle is really different because of the unique circumstances of the pandemic, or whether those circumstances will simply turn out to have delayed the adjustment in the event of the labour hoarding mindset suddenly cracking. Thomas expects the stress on reducing labour costs while avoiding outright unemployment to continue because “businesses recognize that skilled labor is going to become increasingly scarce as time goes on”. GREED & fear is not so sure about that, given everything being written about robots. It may just be that the extended labour adjustment may be another consequence of the delayed impact of monetary tightening. Meanwhile, American corporates’ success in preserving profit margins can be seen in the ongoing trend in recent quarters whereby top-line growth has been slowing more than bottom line. S&P500 annualised sales rose by 5.4% YoY in the four quarters to 2Q24. By contrast, S&P500 annualised as-reported earnings rose by 8.7% YoY in the four quarters to 2Q24 (see Exhibit 6).
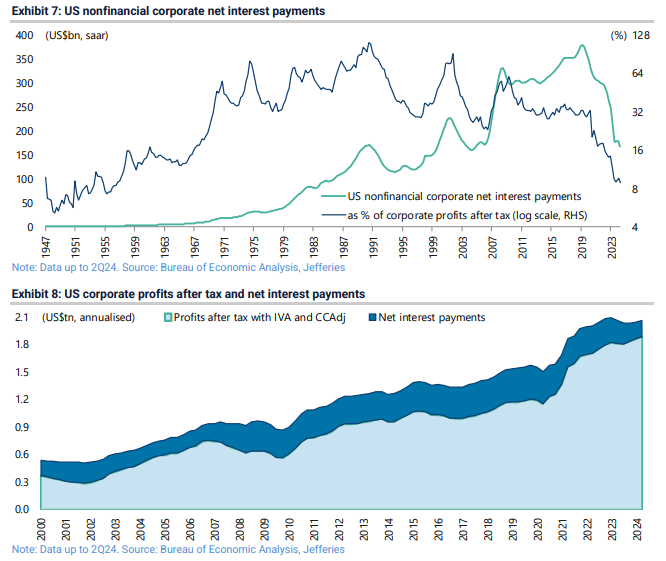
The other important point is the role played by higher interest rates in boosting corporate profits. The counterintuitive point here is that the nonfinancial corporate sector’s net interest payments have declined dramatically in this Fed tightening cycle, as discussed here on several occasions previously (see GREED & fear - No landings and private equity and private credit, 18 April 2024). This is a result of both the increased return paid on cash and the refinancing of corporate bonds at historically low yields. Thus, US nonfinancial corporates’ net interest payments as a percentage of profits after tax have declined from 18.1% in 1Q22 to 8.9% in 2Q24, the lowest level since 3Q56, based on the latest national accounts data. In absolute terms, net interest payments have declined by 44% from an annualised US$297bn in 1Q22 to US$167bn in 2Q24 and are down 56% from the peak of US$380bn reached in 2Q19 (see Exhibit 7)
In this respect, there is some evidence to suggest that the interest rate driver may have been the biggest factor increasing US corporate profits in aggregate. On this point, nonfinancial corporates’ annualised net interest payments have declined by US$106bn since 4Q22 while annualised profits after tax increased by US$86bn over the same period, based on the national accounts data. As a result, annualised corporate profits, before subtracting net interest payments, have declined by US$20bn since 4Q22 (see Exhibit 8).
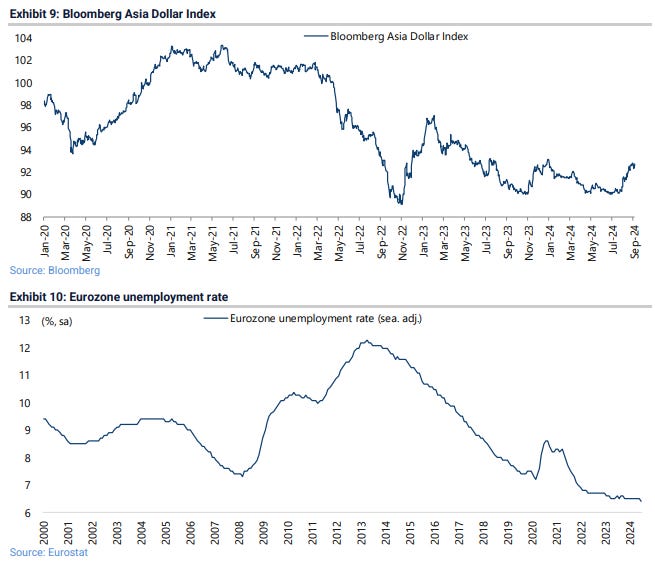
If that is indeed the case, anticipated Fed interest rate cuts may not turn out as positive for US equities as many investors are hoping, though in the case of Asia and emerging market equities, Fed easing would seem to be an unmitigated positive, most particularly if combined with a weaker US dollar. The Bloomberg Asia Dollar Index, which measures the major Asia ex-Japan currencies against the US dollar, has risen by 3.1% from the recent low reached in early July (see Exhibit 9).
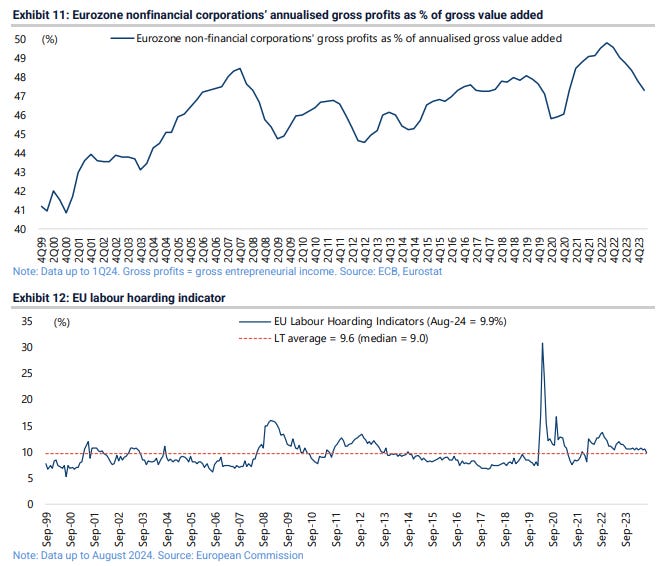
Returning to the issue of the labour market, while the US remains the key focus of investors for entirely understandable reasons, Europe’s labour market has also shown unusual resilience relative to history in the context of the slowdown in growth experienced last year. The Eurozone unemployment rate fell from 6.5% in June to 6.4% in July, the lowest level since the data began in 2000, after having been broadly flat over the past two years (see Exhibit 10). While Eurozone real GDP growth declined from 3.5% YoY in 2022 to only 0.4% YoY in 2023 and 0.6% YoY in 2Q24. The most plausible explanation for this resilience again seems to be labour hoarding in the context of the problem of hiring employees coming out of the pandemic. Still, there is growing evidence that a labour market adjustment beckons in the context of the slowdown in profit growth. On this point, the ECB and European Commission’s data shows that Eurozone nonfinancial corporations’ annualised gross profits as a percentage of gross value added peaked at 49.8% in 3Q22 and declined to 47.3% in 1Q24, the latest data available (see Exhibit 11). As for the issue of labour hoarding, the European Commission developed in July 2023 a new survey-based “labour hoarding indicator” based on its existing business and consumer surveys. This measures the percentage of managers expecting their firms’ output to decline but for employment to remain stable or increase. The EU labour hoarding indicator rose from 8.1% in February 2022 to a recent high of 13.7% in October 2022, though it has since declined to 9.9% in August. This compares with the long-term average of 9.6% since the data series began in 1999 (see Exhibit 12).
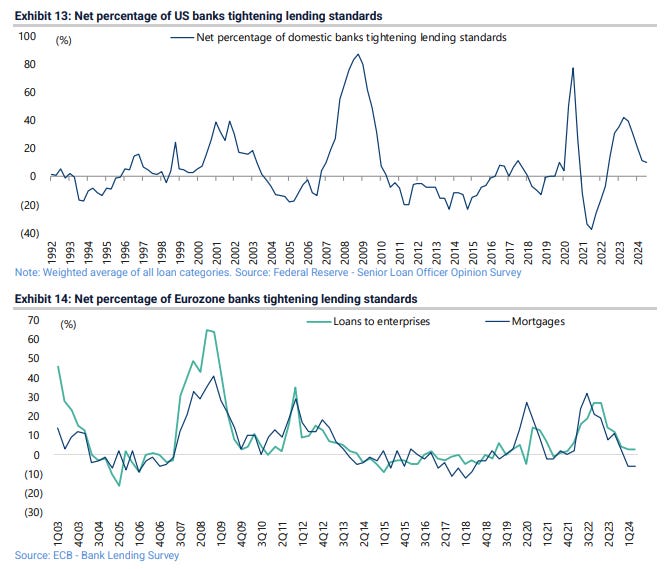
Meanwhile, if the focus remains on the potential for labour market weakening in response to monetary tightening, it also needs to be remembered that the labour market is traditionally a lagging indicator. In this respect, it is worth noting again that, in both the US and the Eurozone, data continues to show an easing of lending standards on the part of commercial banks and a flattening out of loan growth after the decline in commercial bank lending between late 2022 and early 2024. The Fed’s loan officer survey shows that only a net 10.3% of US banks reported tightening lending standards in the July survey, down from 42% in April 2023 (see Exhibit 13). The ECB’s latest bank lending survey published in July also shows that only a net 3% of Eurozone banks tightened credit standards for loans to enterprises in 2Q24, down from 27% in 1Q23. While a net 6% of Eurozone banks eased credit standards for mortgages in 2Q24, compared with a net 32% reporting tightening standards in 3Q22 (see Exhibit 14).
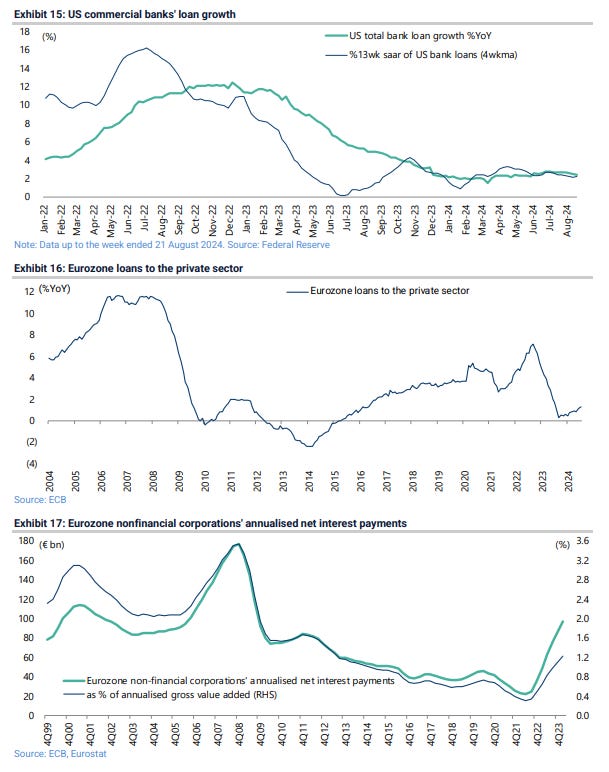
As for actual lending data, US bank loan growth declined from 12.4% YoY in early December 2022 to 1.5% YoY in March 2024 and was 2.4% YoY in the week ended 21 August (see Exhibit 15). While Eurozone bank loan growth to the private sector slowed from 7.1% YoY in September 2022 to 0.3% YoY in September 2023 and has since risen to 1.3% YoY in July (see Exhibit 16). This credit data needs to be watched closely for any signs of a real upturn in credit growth, which would cause a questioning of the current narrative about the commencement of an easing cycle. Money markets are now expecting 236bp of Fed rate cuts by the end of next year and 151bp of cuts by the ECB by July 2025 while the ECB already cut by 25bp in June. Meanwhile, unlike in America, European companies will be positively geared to declining rates. Eurozone nonfinancial corporations’ annualised net interest payments have risen from a recent low of €21.8bn or 0.31% of gross value added in 2Q22 to €96.8bn or 1.22% of gross value added in 1Q24, based on the European Commission’s sector accounts data (see Exhibit 17).
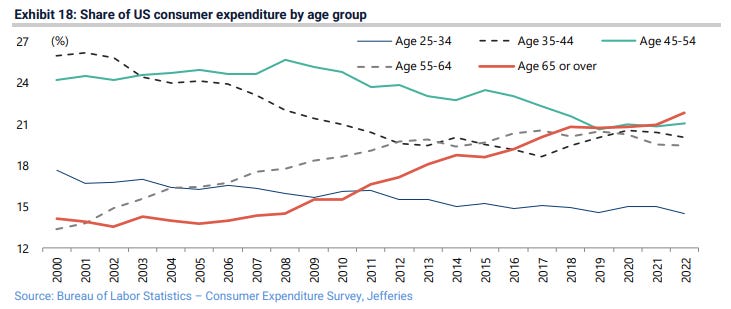
GREED & fear continues to hear the current fashionable term “K-shaped recovery” applied to describe the condition of an economy, be the country under discussion America, Australia, India, or, last week, Indonesia (see GREED & fear - Monetary mechanics and Indonesia, 29 August 2024). In the case of America, the K-shaped dynamic is best reflected in the growing share of household spending accounted for by the Baby Boomer cohort aged 65 or over, as previously discussed here (see GREED & fear - Succession planning and portfolios, 4 July 2024). Americans aged 65 and above accounted for a record 22% of total consumer spending in 2022, the highest share amongst various age groups and up from only 15% in 2010, according to the Labor Department’s consumer expenditure survey released in September 2023 (see Exhibit 18). The 2023 data is due to be released on 10 September.
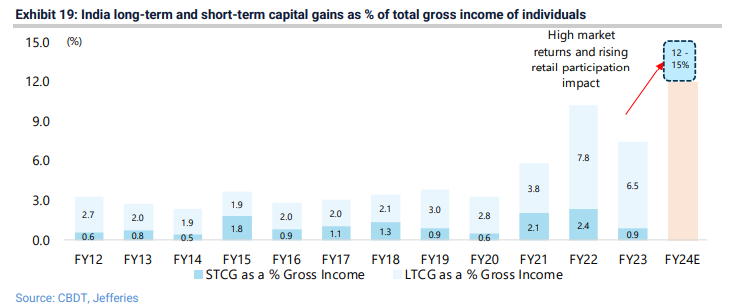
Back in Asia, Jefferies’ head of India research, Mahesh Nandurkar, notes more evidence of the K-shaped nature of the post-pandemic recovery in India’s personal income tax data (see Jefferies research India: Tax Data Shows Rising Cap Gains, K-Shaped Recovery, 26 August 2024). The data also highlights, interestingly, the marked impact on household incomes of India’s roaring bull market in stocks. Mahesh’s analysis of personal income tax data shows that the share of capital gains in total personal income has risen from 4% in FY19 to 11% in FY22 and is expected to be in the 12-15% range in the past fiscal year ended 31 March 2024 (see Exhibit 19). The increased participation of individual investors in the stock market is also reflected in the four- to five-fold increase in the number of individuals reporting short- and long-term capital gains in the period between FY19 and FY23. Thus, the tax data shows that there were 3.9m individuals reporting long-term capital gains and 4.7m reporting short-term capital gains in FY23, up from 0.8m and 1.1m, respectively, in FY19.
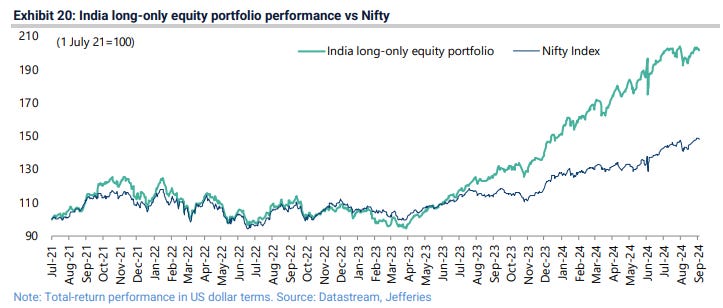
If this is a testament to the gains made in India’s bull market, GREED & fear remains astonished that the recent rise in both short- and long-term capital gains tax in India did not have more of a negative impact on the stock market. The Nifty Index remains only 0.5% below its all-time high reached on Monday while GREED & fear’s India long-only portfolio is down only 1.2% in US dollar terms since peaking on 31 July (see Exhibit 20). Remember that the government raised the short- and long-term capital gains tax rates by 5.0ppt/2.5ppt to 20% and 12.5%, respectively, in the FY25 budget in July. “Long-term” is defined as holding a stock for more than one year.
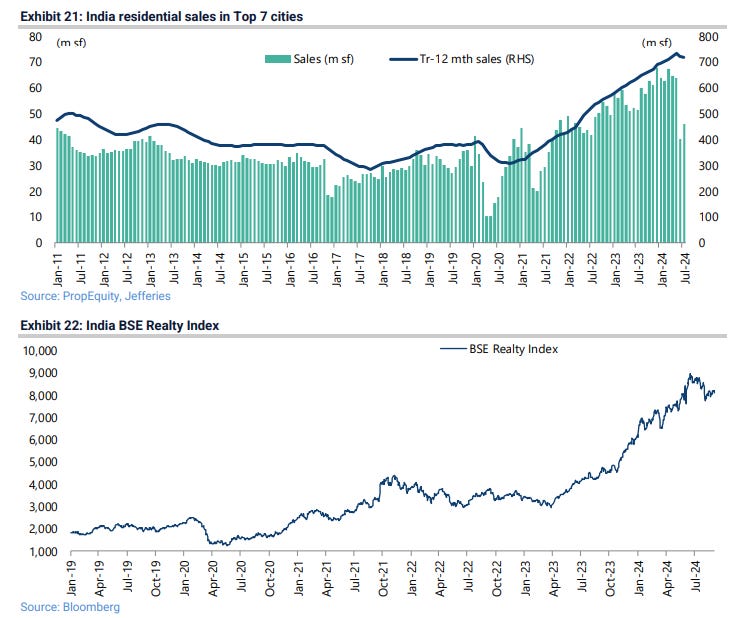
Jefferies’ India office projects capital gains tax to generate about Rs1.6tn in revenue this fiscal year ending 31 March 2025, up from an estimated Rs1.3tn in FY24. While the Indian stock market remains impressively resilient, it has to be admitted that the increase in capital gains taxes makes GREED & fear somewhat nervous. After all, in many Asian markets, investors, be they local or foreigners, face no capital gains at all. It is also the case that Mahesh believes that another hike could happen in the context of the current government’s five-year term. Staying on the subject of India, GREED & fear’s India portfolio still has a 19% weighting in Indian property stocks. It is therefore worth noting that the residential property market slowed in the June-July period, as discussed in a report published last week by Jefferies’ Indian property analyst, Abhinav Sinha (see Jefferies research India Property - Transient volume weakness, 29 August 2024). Residential sales volume in the top seven cities declined by about 10% YoY in July after a 22% YoY fall in June (see Exhibit 21).
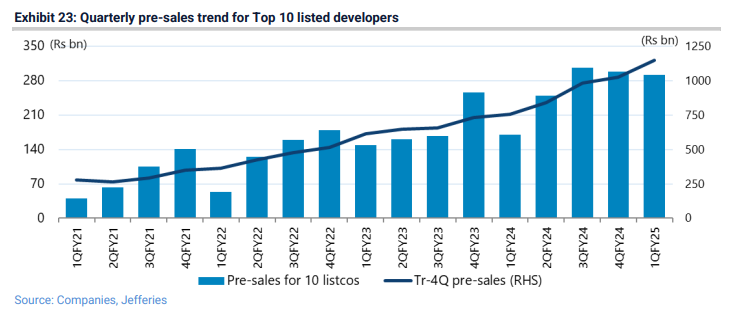
Still, in GREED & fear’s view, it is way too premature to call an end to the cycle, though a pause to refresh is both healthy and to be expected. The same applies to the property stocks, with the BSE Realty Index down 10% from its June high but up by 173% since late March 2023 (see Exhibit 22). Abhinav notes that the top 10 listed developers are guiding for 15-35% pre-sales growth this fiscal year ending 31 March 2025. This is viewed as achievable, even though it is below the 71% YoY pre-sales growth enjoyed by leading developers in 1QFY25 ended 30 June (see Exhibit 23). Meanwhile, staying on the K-shaped theme, one issue for the Indian property market is whether there will be a broadening out of demand in a residential property market where the action has been primarily in the high-end segment. So far, there has been no evidence of such a broadening. One potential driver here could be rate cuts if the RBI follows the Fed, as is likely, after the commencement of Fed easing. Jefferies’ India office expects a 25bp rate cut this year to 6.25% and a total of 100bp in this easing cycle.
Meanwhile, capital gains tax has also been a topical issue in India of late as regards property. Traditionally, capital gains tax on property is only based on profits after netting out the impact of inflation, or so-called indexation. The budget announced in July proposed to remove the indexation benefit while lowering the longterm capital gains tax for property from 20% (with indexation) to 12.5%. A subsequent hue and cry caused the government to reintroduce the indexation relief for property owners. For properties purchased before 23 July, the long-term capital gains tax can be calculated either at the rate of 12.5% without indexation or 20% with indexation. But this has only been for those living in India. Non-resident Indians (NRIs) will no longer enjoy the indexation relief. This differing tax treatment of resident Indians and NRIs creates a precedent which is not perhaps ideal. Still, it reflects the reality that the Modi government in its third term is sensitive to K-shaped recovery issues following its worse-than-expected performance in the April-May general election.
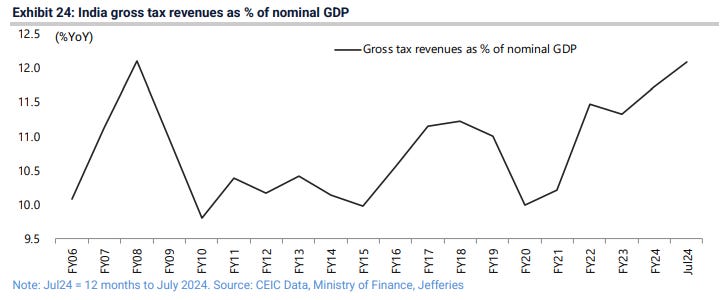
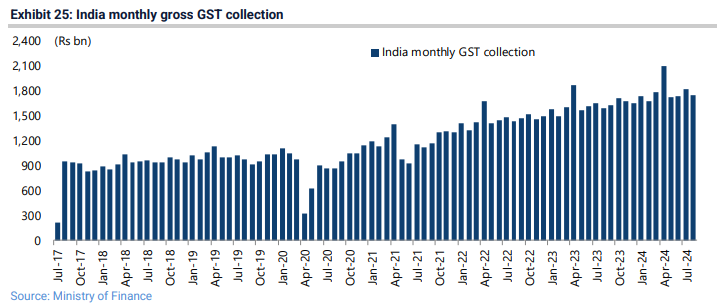
Meanwhile, staying on the subject of taxation, gross tax revenues to nominal GDP were 11.7% in India last fiscal year and an annualised 12.1% in the 12 months to July, up from 10% in FY15 (see Exhibit 24), helped by the likes of demonetisation in 2016 and the successful rollout of GST in July 2017 (see Exhibit 25). Still, Mahesh notes that only one-third (30m) of those filing digital tax returns are actually paying income taxes, a figure which is smaller than the 35m installed car base in India.
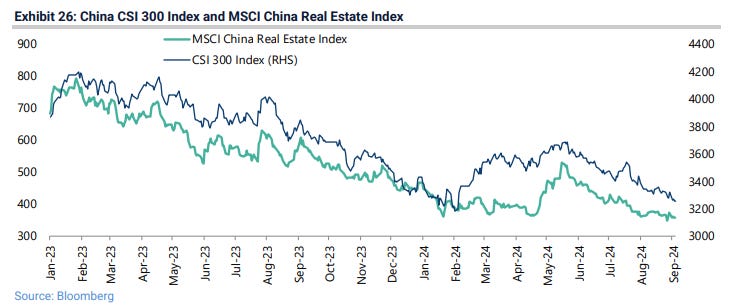
Elsewhere in Asia, there has been another effort in recent days to boost sentiment in China’s property market. GREED & fear refers to a proposal reported by Bloomberg to allow for the refinancing of existing mortgages, which totaled Rmb38tn at the end of 2Q24. Under the plan, homeowners would be able to renegotiate terms with their lenders before January, when banks typically reprice mortgages, according to “people familiar with the matter”. They can also refinance with a different bank (see Bloomberg article: “China Mulls Allowing Refinancing on $5 trillion of mortgages”, 30 August 2024). Jefferies’ China economist, Shujin Chen, estimates that the refinancing move could lower the average existing mortgage rate by 55-100bp, potentially saving homeowners about Rmb300bn per year (see Jefferies research China Macro Chat: China May Allow Mortgage Refinance – What Will the Impact Be?, 1 September 2024). Still, the news has had scant impact on investor sentiment in terms of the stock market response, or the lack of it. The CSI 300 Index and the MSCI China Real Estate Index rose by 1.3% and 4.3%, respectively, last Friday but have since declined by 1.9% and 4.2% (see Exhibit 26).
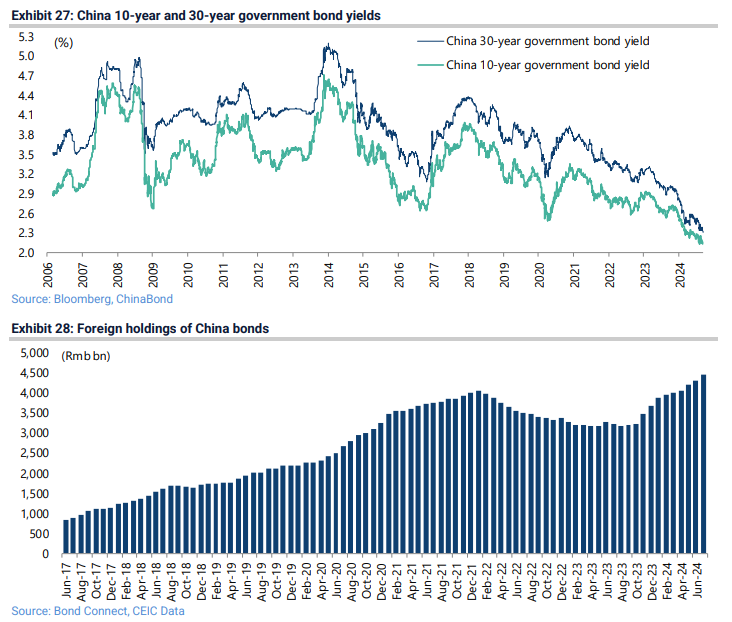
Meanwhile, long-term yields in the government bond market continue to turn down in spite of the PBOC’s efforts to impose reverse yield curve control previously discussed here (see GREED & fear - Bond fiddling and collision courses, 15 August 2024). The China 10-year and 30-year government bond yields have declined from recent highs of 2.26% and 2.45% in mid-August to 2.13% and 2.31% (see Exhibit 27). Befitting China’s ongoing bull market in government bonds, it is also the case that, while foreign investors have continued to exit China equities, they have been net buyers since last September of renminbi-denominated bonds. Indeed, their holdings are now at an all-time high. Thus, foreign holdings of China onshore bonds declined from a previous high of Rmb4.07tn in January 2022 to Rmb3.17tn in April 2023 and Rmb3.18tn in August 2023 and have since risen to a record Rmb4.456tn in July 2024 (see Exhibit 28).
In this respect, while there is now an interesting debate about whether risk parity is returning as an appropriate investment strategy in the US and G7 markets, what is abundantly clear is that risk parity has worked extremely well in the current macro deflationary context of China, in the sense that government bonds have proved the best hedge for owners of China equities. In this respect, while the deflationary pressures persist, the only practical strategy for investors in China equities remains bottom-up, as previously discussed here (see GREED & fear - The message of a bond market, 25 July 2024).
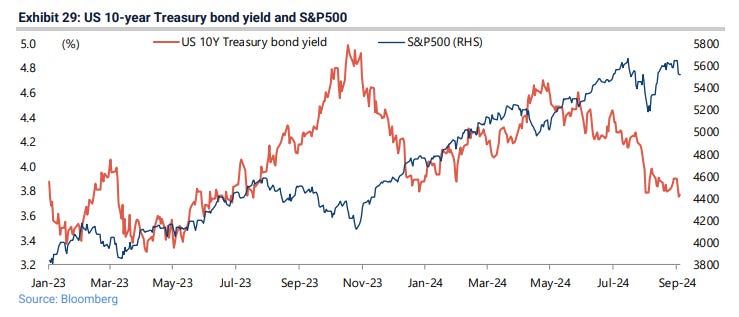
As for risk parity in the US, GREED & fear will admit that Treasury bonds rallied in the recent yen-carry-tradetriggered equity unwind, which has been the highlight of this summer’s silly season (see Exhibit 29). But the real stress test of risk parity will only happen in a real US downturn, and that has not happened yet. This is the question of whether the decline in tax revenues to be expected in such a downturn would trigger supply concerns in the Treasury bond market. What is absolutely clear is that risk parity stopped working with the onset of the pandemic when Jerome Powell and company decided to finance fiscal handouts.


