Goldman Sachs: What Parts Of the US Economy Are Most Sensitive to a Trade Conflict With China? (12/25/2024)
Goldman expects the new administration to increase tariff rates by as much as 60% for non-consumer goods on lists 1-2 but expects smaller tariff increases for most of the consumer goods that are on lists 3-4, resulting in an average 17% increase in tariff rates on imports from China.
Which Consumer Spending Categories Are Most Exposed?
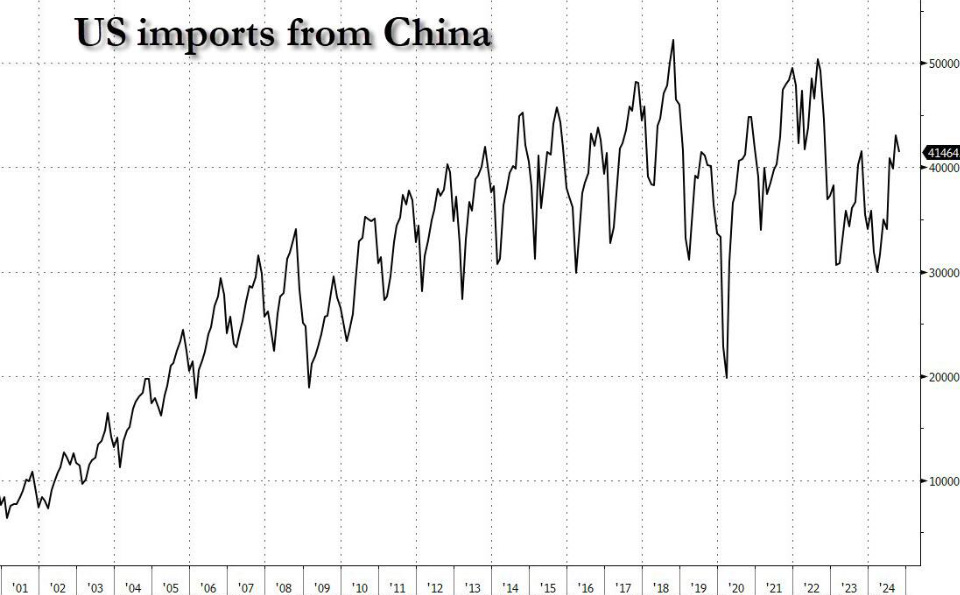
By way of background, note that the overall US reliance on Chinese exports has declined, at least superficially, in the past decade, as aggregate goods imports from China have declined from 18% of total US imports at the peak reached before the first Trump administration imposed tariffs to 11% today.
To estimate the share of Chinese-origin goods in total US consumption, Goldman used detailed trade data and the Bureau of Economic Analysis’s industry-level input-output table, which allowed it to trace out the total value contribution from an imported commodity to an industry’s production value and ultimately to final consumer expenditure.
Using this approach, Goldman estimates that import content from China accounts for 7% of the producer value of goods consumed in the US (the purchaser value excluding transportation, wholesale, and retail costs and margins), or 3.3% of final consumer expenditure on goods (or the final consumer price of goods). About 80% of this import content from China consists of direct imports of final consumer goods, while the remaining 20% consists of intermediate goods and raw materials used in domestic production of consumer goods. Imports from China also contribute modestly to the producer value of services consumed in the US. Accounting the contribution to both services and goods, we estimate that imports from China account for 1.4% of final core consumer expenditure.
That said, the US still relies heavily on China for many consumer products.
To see where the US is most exposed, Goldman looked at the share of imports of various goods that are sourced from China. The left side of the chart below shows that imports from China still account for over 80% of total US imports of several major household products such as appliances, furnishings, and footwear. The right side shows that China is the top exporter of these products by a large margin, contributing over 60% of world exports versus less than 10% for the second largest exporter. This means that sourcing these consumer products from other exporters would be difficult in the near term, as other exporters may lack the capacity to scale up production.
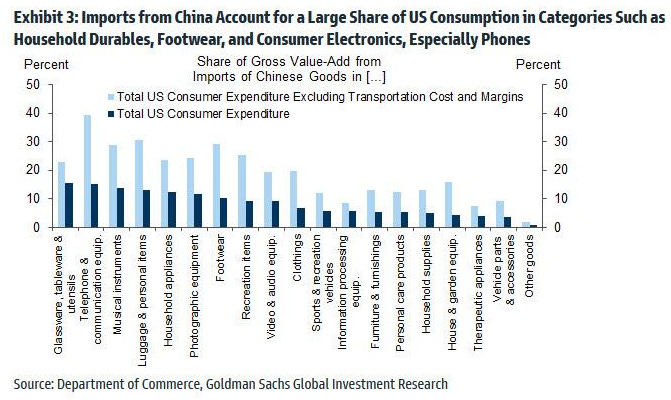
The bank then used the input-output tables to estimate the shares of Chinese import content in the total producer value and in total consumer expenditure by category. The former is a rough approximation of the price-adjusted share of the volume — what share of shoes purchased in the US come from China, counting an Italian pair as two if it costs twice as much to produce. The latter is the share of the final consumer price attributable to Chinese import content, which will usually be much smaller because much of the final consumer price consists of transportation, wholesale, and retail costs and margins.
The next chart shows that imports from China are a particularly significant share of producer value for durable household items such as glassware and tableware (23%) and appliances (24%), some nondurable items such as footwear (30%), and consumer electronics (10-39%), especially telephones (39%) and photographic equipment (24%).
Naturally, tariffs would have the largest impact on consumer prices in these highly exposed categories. To estimate the impact, Goldman combined its assumptions about the tariff rate increases that will be applied to the lists of goods shown in the first chart with its analysis above of the shares of Chinese import content in US consumption, both directly and as an input to US production of consumer goods.
The analysis suggests that if the tariffs were fully passed through, they would raise US consumer prices of Chinese-origin goods by 2-10%. But even in these most-exposed categories, and even assuming no substitution toward goods not hit with tariffs, the effect on average consumer prices across all production origins—the numbers reported in the official inflation statistics—would still be only 1-2%, highest for kitchenware, appliances, luggage, recreational items, footwear, and computer equipment.
The impact on overall core consumer prices would be much smaller if one includes less-exposed goods as well as services. Assuming that sellers are able to fully pass the cost increases to consumers and there is no trade diversion, Goldman economists estimate that tariff increases on imports from China under the baseline assumptions would raise core PCE prices by about 0.24%, and increases on both autos and imports from China together would raise core PCE prices by 0.3%.
Which US Industries Are Most Exposed on the Production Side?
From a production perspective, tariffs could hit output and profits in three ways.
First, tariffs on imported intermediate inputs would raise US producers’ production costs. Under the Goldman baseline tariff policy assumptions, the weighted-average increase in the tariff rate on inputs from China would range across US industries from 10% to 40% and average about 20% (Exhibit 5, first column of numbers). But this form of exposure is nonetheless fairly modest because only in a handful of industries do Chinese-origin inputs account for even 3% of the value of all inputs used by US producers (Exhibit 5, second column). In the average industry, inputs from China account for just 0.7% of all inputs and 0.3% of gross output (Exhibit 5, second and third columns), and these figures are still just 1.2% and 0.6% in the 90th percentile industry by China exposure.
Multiplying the average tariff rate that would be applied to inputs used by each industry by the share of imported inputs in that industry’s gross output, Goldman estimates that the tariffs would raise production costs by only about 0.5-0.7% of final output costs in even the most-exposed industries. Some of these industries have thin margins, however, and this amounts to 10-30% of operating surplus in industries such as machine tools, auto bodies, furniture, and textiles.
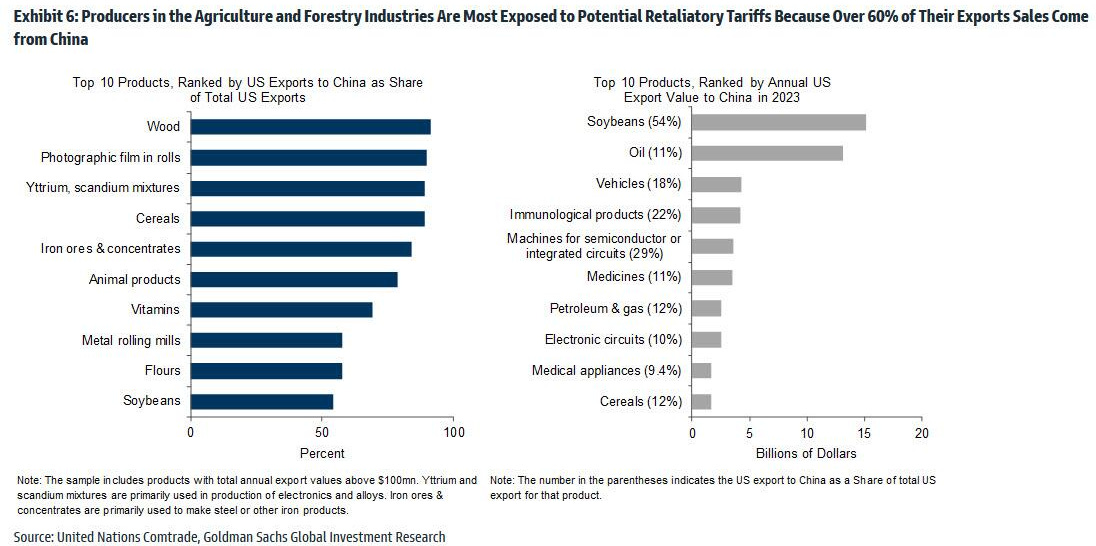
Second, retaliatory tariffs imposed by China could negatively affect US exporters. The left side of Exhibit 6 shows the products where the largest percentage of US export sales of that item go to China, while the right side of Exhibit 6 shows the top US exports to China by dollar amount. More than 80% of US wood, cereals, iron ores, and animal products exports go to China, as do more than 50% of soybeans—the US’s largest export to China—and nearly 20% of autos.
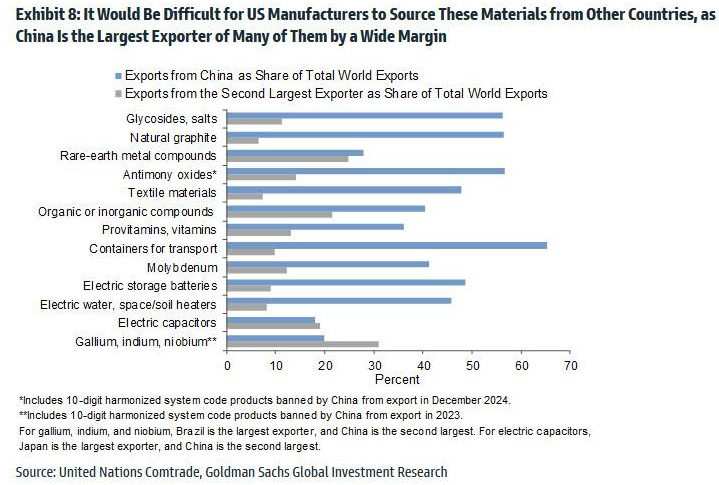
Third, potential non-traditional forms of retaliation such as export restrictions by China could limit US producers’ access to important inputs. Exhibit 7 shows that over 70% of US imports of certain raw materials including natural graphite, rare-earth compounds, and antimony oxides are currently sourced from China.
Worse, for many of these materials, it is not easy to substitute alternative materials for them in industrial processes or to source them in sufficient size from other countries, as China remains as the largest producer and exporter of these materials.
These materials are critical inputs into the production of batteries, alloys, magnets, and electronics, which are then used as key inputs into many upstream industries including autos, smartphones, computer hardware, and defense technologies. In other words, if the next trade war truly escalates, then multiple highly specialized industries could suddenly find themselves paralyzed and scrambling for commodities in a world where China is now the commodity sole-source supplier for so many highly specialized and sophisticated end markets.


