


Goldman Sachs: US Equities Positioning (10/04/2024)
Portfolio Manager’s Summary
US stocks traded higher on Friday with the S&P 500 up slightly on the week, as investors react to a much stronger-than-expected payrolls report on the heels of better ISM business sentiment surveys. China ADRs, AI Power, and Commodity Sensitive stocks logged the largest gains on the week, while Bitcoin Sensitive Equities, Non Profitable Tech, and Renewables underperformed.
Prime: US equities saw the largest net selling in 6 weeks into NFP, driven by short-and-long sales in Macro Products. Single stocks were modestly net bought, led by buying in TMT/Energy/HC vs. selling in Consumer Disc/Industrials/Real Estate. While HFs were buying Info Tech stocks this week, they’ve continued to rotate out of Mag 7 names. Amid heightened geopolitical tensions and strength in crude oil prices, Energy stocks were net bought for the first time in 7 weeks, driven almost entirely by short covers.
Shares: LOs finished +$3.5b net buyers while HFs were slight net sellers (~$450m) on the week. Desk flows in China ADRs became more balanced with clients selling strength towards the end of the week – investors believe there is more upside but ultimately a momentum trade where a reversion could happen. We continue to see defense in select oil/gas services names by both client types. On the other hand, we are not seeing an overwhelming 'flight to safety' into Tech despite macro uncertainty.
Futures: From last week’s quarter-end driven pop, TRF funding levels are set to end the week down ~20bps, which reflects easing balance sheet constraints and possibly some selling from end-users in the futures markets. In rates, while yields rose sharply on the back of the strong NFP print, desk flows on Friday following the number were skewed towards buying in UST futures across the curve, which is likely a reflection of the near-record short positioning among the “levered” category in the CFTC CoT data.
Derivatives: Following the events in early August, geopolitical tensions, and the pending US election, there is a very clear divergence between equity “vol stress” and generic “equity vol”, and the market is pricing in significant stress under the hood despite relatively calm VIX levels. Given the set up under the surface + attractive optics on vanilla put spreads, the desk likes owning SPX 3 month 96.5 / 88 vanilla put spread or SPX 3 month 96.5 / 88 knock out put (continuous) as a year-end hedge.
ETFs: Off-shore institutional funds have been systematically underinvested in China and are chasing upside via demand in FXI and ASHR. The desk likes selling ASHR vs. buying FXI as a relative value trade: (1) As % of AUM, ASHR has seen 2.5x of primary inflows as FXI and is trading at a relative premium; (2) ASHR is seeing artificially high on-screen demand, causing it to trade rich to NAV; (3) ASHR has a higher beta to local China policy and could have more to lose once the demand frenzy begins to subside.
Baskets: The sensitivity of our Republican Policy Outperformers (GS24REPL) to election events since this summer implies it could move +8% if Trump wins the presidential election. Over the summer, investors have tactically traded around election events and have shortly unwound their trades. Given we are only 32 days away from election day, we notice a shift in focus: our clients nearterm outlook depends on the election outcome, and they are becoming more comfortable positioning themselves accordingly.
Sector Specialists: Energy led the upside after we exited the prior week with aggressive HF short selling that flipped this week – All eyes on incremental news regarding any attack on Iranian energy infrastructure, which would pose further upside risk to the commodity and equities. It was a volatile week for healthcare, where Managed Care was the epicenter of dispersion. Most in focus was HUM (-25% on the week), with brewing fear in the broader Managed Care complex into the annual Medicare STARs process.
Risk Exposures: US Fundamental L/S Gross leverage fell -1.5 pts to 192.2% (65th percentile three-year), and US Fundamental L/S Net leverage fell -0.9 pts to 52.1% (40th percentile three-year). US Fundamental long/short ratio decreased -0.5% to 1.745 (29th percentile three-year).

Trading Flows: Overall US equities saw the largest net selling in 6 weeks (-1.1 SDs one-year) and were net sold in each of the past 4 sessions, driven entirely by short sales (mainly via Macro Products) as long flows finished ~flat.
Reversing last week’s buying activity, HFs net sold Macro Products (Index and ETF combined) at the fastest pace since early January (-1.4 SDs), driven by short sales and to a lesser extent long sales (2.8 to 1).
Single Stocks were modestly net bought this week (+0.2 SDs), driven by long buys outpacing short sales. 7 of 11 sectors were net bought on the week, led in notional terms by Info Tech, Energy, Health Care, and Comm Svcs, while Consumer Disc, Industrials, and Real Estate were the most net sold.
After selling the sector for 5 consecutive months, this week HFs net bought Info Tech at the fastest pace since May, driven by long buys and to a lesser extent short covers (3 to 1). Most of the subsectors were net bought on the week, led by Software and to a lesser extent Semis & Semi Equip.
However, Megacap Tech stocks (Mag 7) collectively were net sold for a 9th straight week (12 of the last 13). Net length held in this cohort – as % of total US exposure – is now at the lowest level since May ‘23.
Amid heightened geopolitical tensions and rising crude oil price, HFs reversed course and net bought US Energy stocks for the first time in 7 weeks, driven almost entirely by short covers. US Energy long/short ratio increased +5% – the largest weekly increase in nearly 5 months – to 1.36, which is in the 69th percentile vs. the past year and 14th percentile vs. the past five years.

SPX finished ~flat on the week with risk appetite dampened by middle east tensions, port strikes, Crude now >$74, Election looming, China policy, etc. Much of the GARPY / FAAMG types of names lagged today as investors work to manage the 'tails' in cyclicals following a very robust payrolls print this AM. Headline NFP came in @ 254k vs. 150k cons; UE @ 4.05% unrounded vs. 4.2% cons; AHE MoM comes in @ 0.4% vs. 0.3% cons. This follows better ISM business sentiment surveys we got earlier this week. 25bp cuts at the November and December meetings are base case.
On the week, LOs finished +$3.5b net buyers while HFs finished slight net sellers (~$450m). Trading remained macro focused with overall sector skews benign. Our flow picture in China ADRs became more balanced with clients selling into strength towards the end of the week – investors believe there is more upside but ultimately a momentum trade where you could see reversion. We continue to see defense in select oil/gas services names by both client types following the aggressive PB selling/short selling we saw last week (largest in > 5yrs // one of most net sold sectors in book for Sept). Despite macro uncertainty, we are not seeing an overwhelming 'flight to safety' into tech (for now).
On tap next for next week: FOMC minutes (wed), US CPI (thurs), Auto updates (GM analyst meeting Tues + TSLA robotaxi product launch Thurs). Earnings include DAL & DPZ (thurs) + Bank kickoff Fri (BK, BLK, FAST, JPM, WFC). Bond auctions (3yr Tues, 10yr Wed, 30yr Thurs) + a slew of Fed speakers.

Equity futures rallied into the quarter end close on Monday with ESZ4 +1.1% in the final 90min of the cash session to close +40bp on the day. The market failed to hold onto those gains, closing lower on Tuesday (ESZ4 -0.94%) and struggling to find direction even after the stronger payrolls data on Friday (currently down 38bp on the week). TRF funding levels are set to close the week down nearly 20bps from last week’s quarter-end driven pop to FF+87.5 (AXWZ4 mid is currently FF+69). The move to the highs last Friday was symptomatic of the stretched long positioning in equity futures (see Chart 1 for last week’s CFTC CoT data, which hit new record nominal highs following expiration week) and dealer balance sheet constraints into quarter end. The reversion this week is reflective of easing balance sheet constraints and possibly some selling from end-users in the futures market, from the record highs. Turning to China, the stimulus-driven rally in local equities looks set to continue when the market reopens following the Golden Week holiday on Tuesday – SGX-listed A50 futures have rallied ~11% from Monday’s close when the local market was last open.
Crude oil and products rallied sharply this week (Chart 2) as the situation in the Middle East continued to deteriorate. On Tuesday, spot month WTI and Brent rallied >5% from the lows on the initial headlines from the White House that an Iranian attack was imminent. GIR noted on Tuesday that the jump in oil prices reflected a moderate risk premium as actual production disruptions have been limited and spare capacity remains elevated. The energy complex jumped again Thursday on news that the US was considering whether or not to support Israel’s potential retaliatory attacks against Iranian energy infrastructure (CLX4 +5.15%, COZ4 +3.72%). Despite the volatility in the energy complex, price action in metals was more muted – gold (GCZ4) only managed to rally 50bps despite the Mid-East escalation and LME 3m copper actually fell ~50bps despite the rally in other China-oriented markets.
In rates, yields increased sharply on the back of the NFP print, with 10y yields +12bp to 3.96% at the time of writing. Fed Funds futures were pricing a ~30% chance of a 50bp cut in November just before the number and are now pricing just less than a full 25bp cut (95% implied probability of a 25bp cut). Flows through our desk on Friday following the number were skewed towards buying in UST futures across the curve, which is likely a reflection of the near-record short positioning in UST futures among the “levered” category in the CFTC CoT data (Chart 3).


Source for all charts: Bloomberg, Goldman Sachs FICC and Equities data as of 4-Oct-24. Past performance is not indicative of future results.
Spot vix is not telling the whole story…
1/ chart below is an overlay of equity “vol stress” vs generic “equity vol” … there is a very clear divergence following the events of 5August, geopolitical tensions, and pending US election.
2/ we define “vol stress” as a 2 year rolling percentile rank of 1/ skew, 2/ term structure, 3/ spx implieds, and 4/ vix implieds.
3/ bottom line … our market is pricing in significant stress under the hood despite relatively calm vix levels … clients are using dynamic to reduce the cost of downside.


Favorite hedge into year end
quite vanilla - but 8:1 with "realistic" strikes to protect a decent year is worth a highlight.
given the move in SPX skew and the setup for implieds thru the US election … the optics of vanilla put spreads are attractive.
ref 5752 es1, the SPX Dec 5500 / 5000 put spread is offered ~$62 … 8:1 max payout (gross) … 7 vols of skew (19 vs 26) and 18 delta at inception.
if you set this trade as a barrier (continuous observation) … the cost is reduced by 80% … which ranks in the ~95th percentile in terms of attractiveness (below).
*max loss of both structures is premium paid


source for all graphs: gs global banking and markets / as of 1oct24 / past performance not indicative future returns3
ETF Trading:
TLDR: China Relative Value ETF Trade Idea. Trust us, it’s worth the read.
China FOMO – But What is the Trade?: Off-shore institutional investors are systemically underinvested in China – our clients are chasing upside via ETFs through outright demand in FXI and ASHR. However, these products are not one and the same.
There are structural differences in H vs A-Shares that create trading opportunities. Here are the key 3:
There is a structural barrier-to-entry in local A-shares: investing in A-shares require a government-issued trading ID, whereas H-shares do not. ASHR breaks down this structural barrier for off-shore investors. It is the one liquid cash vehicle that is accessible during US hours.
FXI offers cheap entry into a highly taxed local H-shares market. The ETF wrapper is an efficient vehicle for foreign investors who would be realizing 10x the amount of local stamp in H-shares vs A-shares. FXI does not trade at a relative premium to ASHR – this cost is internalized by market makers who are active in the primary markets.
Historically, A-shares have a higher beta to government-sponsored fiscal and monetary policy intervention. Skepticism around the Chinese government’s involvement with the local stock market make A-shares more susceptible to a downside surprise.
ETF Trade Ideas:
CHINA REL VAL: SELL ASHR / BUY FXI
THE PITCH:
As a percentage of AUM, ASHR has seen 2.5x the amount of primary inflows as FXI. Looking at historical biases vs fair, ASHR is trading at a relative premium to FXI.
ASHR is the only US-based cash vehicle for clients looking to invest in local markets who do not have the government-issued trading ID. Because of this, ASHR is seeing artificially high on-screen demand, causing it to trade rich to NAV. Post stimulus, FXI traded a record-breaking 168m shares (9/24), which is 4x its two-month average volume. On the same day, ASHR traded 8x its two-month average.
ASHR has a higher beta to local China policy – with the bulk of the positive stimulus behind us, A-shares have more to lose once the frenzy of demand begins to subside.
TIMING: China local A-shares reopen on October 8th while H-shares have been open and liquid. This injection of liquidity can serve as a possible point for profit-taking given the current timing disconnect.

INDICATIVE PRICING: The GS ETF Desk has been incredibly active in the space and can price risk blocks as well as working order situations.
Disclaimer: Max Loss Amount Invested Source: Goldman Sachs FICC & Equities as of 10/03/2024. Past performance is not indicative of future results.
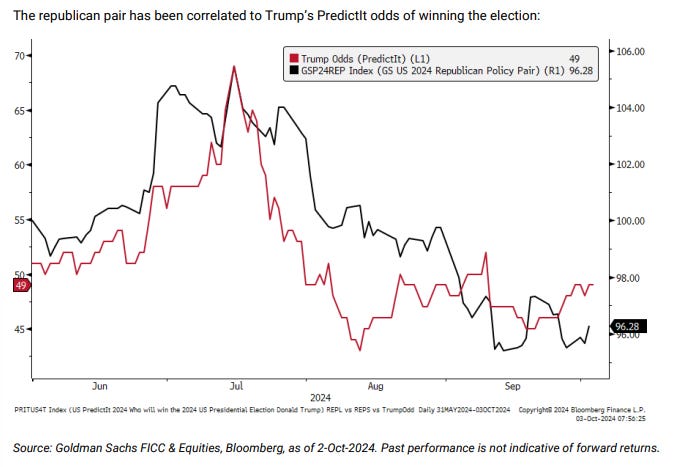
The sensitivity of our Republican Policy Outperformers (GS24REPL) to election events since this summer implies the it could move +8% if Trump wins the presidential election and his PredictIt odds of winning go up to 100%. Over the summer, investors have tactically traded around election events and have shortly unwound their trades. Considering we are only 32 days away from election day, we notice a shift in focus: our client near-term outlook depends on the election outcome and they are becoming more comfortable positioning themselves accordingly.
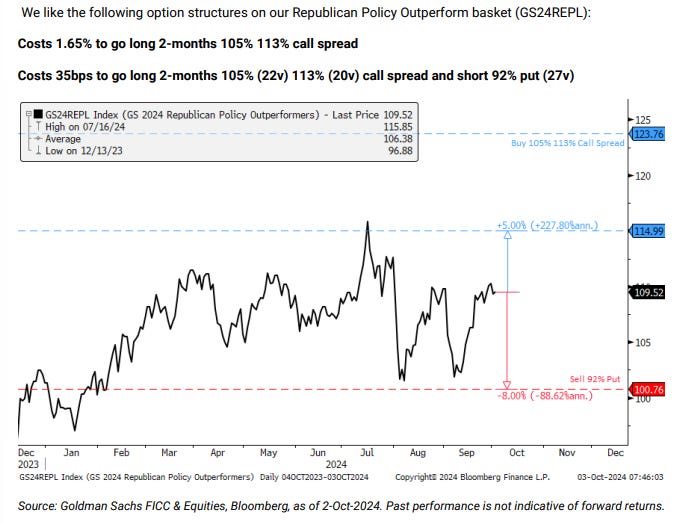
The sensitivity of our Republican Policy Outperformers (GS24REPL) to election events since this summer implies the it could move +8% if Trump wins the presidential election and his PredictIt odds of winning go up +51pp to 100%


In 2016, Hillary Clinton was leading in the polls and Trump lagged. Trump’s RealClearPolitics odds were not in-line with the results of the election. That being said, this presents opportunity prior to the election as well as on the day after the election. Election sensitive stocks tend to trade the outcome through year-end:

All baskets have been constructed by the custom baskets desk in FICC & Equities unless specified otherwise. All references to “we/us/our” refer to the views and observations of the custom baskets desk. Max loss is unlimited for swaps and equal to premium paid for options.
Health Care (Jon Chan)
A volatile week for healthcare, where Managed Care was the epicenter of dispersion. Most in focus was HUM (-25% on the week), with brewing fear in the broader Managed Care complex heading into the annual Medicare STARs process -- with the initial pullback this week sparked by the release of the CMS Plan Finder tool earlier on Tuesday and culminated in a second day of material weakness after HUM disclosed a significant degradation in expected 4+ STAR penetration within its membership base. The company did frame the potential for reprieve via an appeals process and/or other mitigation efforts – driving a bounce off lows though shares likely remain in a holding pattern until resolution. Conversely, CVS has had a much more constructive cadence of news flow – with news of activism and other potential value unlocking actions in focus, while the company also seemingly navigated through the Medicare STARs process unscathed – though awaiting full confirmation into the official release next week. Specialist focus quickly gearing towards the forthcoming 3Q earnings season, where the marginal talking points have skewed more cautiously particularly around utilization-levered hospitals/medtech and key product launches in Pharma (where NVO’s GLP-1 franchise is a key focus) in conversations on the week.
Industrials and Energy (Ryan Novak)
Energy led to the upside on the week after we exited the prior week with aggressive PB selling/short selling that flipped this week, managed money positioning remains short - at all-time lows and tensions across the Middle East escalating with Israel beginning its ground invasion. E&Ps led on the week +7%. All eyes on any incremental news regarding any attack on Iranian energy infrastructure which would pose further upside risk to the commodity and equities. Transports led on the downside last week down 3% with the East Coast Ports officially striking Tuesday and ultimately coming to a resolution by Thursday evening. The bull case for tightening supply chains and transports equities has been pushed to the right. Utilities were flat on the weak but saw continued strength in IPP names as investors continue to chase the power theme, looking for incremental exposures in nuclear and uranium. Early off cycle earnings were better than feared for lighting manufacturer AYI closing up 13% on the week and coatings company RPM up 4%. Airlines were up on the week led by JBLU +16% as concerns arose around the survival of SAVE Friday after headlines about a potential bankruptcy filing swirled. RIVN closed at the bottom of the board down 12% after missing quarterly delivery expectations and lowering the full year delivery estimate. Next week, we start to see early Q3 earnings reports with industrial distributor FAST and in airlines DAL will kick things off.
Source: Goldman Sachs FICC & Equities as of 4-Oct-24. Past performance is not indicative of forward returns.