


Goldman Sachs: Trading Desk 06/17/2024
FOCUS FACTOR…
GS DESK ACTIVITY… We continue to see continued demand from the LO (large cap tech) community while the HF flow has been more defensive and lacks speed. We continue to build momentum on larger liquidity trades for clients, trading over $4 billion so far this month… Last week ended with another big buying tilt by LOs, amounting to $8.5 billion, while that HFs were net sellers of $1.5 billion. The demand in order of magnitude was observed in Macro Products, Information Technology, Communication Services and Discretionary. The financial sector was the only one net sold in the week.
CHINA MACRO… China's housing market difficulties deepen despite stimulus. WSJ. In major cities, new home prices fell 4.3% in May compared with a year earlier, worse than the 3.5% drop in April, according to data released Monday by China's National Bureau of Statistics. Prices in China's second-hand housing market fell 7.5%, compared to a 6.8% drop in April. The worst pain is in the real estate sector, which has been struggling to deal with oversupply and weak buyer sentiment since 2021, when a multi-year housing boom ended.
SECTOR SPECIALIST… Industrials, materials and energy, all traded lower during the week. Rate-sensitive names soared after a lower CPI reading. AZEK, TREX, MAS, LII, WSO are up 5-10% on the week with homebuilders also strong. Friday poured cold water on short-cycle industrials with a pre-announcement from industrial distributor MSM, causing a sharp downward move in related names. Energy saw an orderly sell-off with consensus longs LBRT, CNQ lagging and refineries, which are shorted, falling more modestly.
GOOGL/AI… Google may not have received headlines at WWDC, but the company's data centers (and its TPUs, which compete with Nvidia's GPUs) are playing a crucial role behind the scenes in powering Apple Intelligence – LINK
FRANCE… French bond collapse halts as traders assess Le Pen's assurances. The stabilization follows the worst week since 1990 for the 10-year spread. The leader of the National Rally tells a newspaper that she would work with Macron – BBG
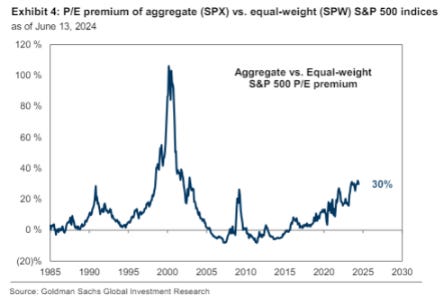
GIR RAISING 2024 PT… We raise our year-end target for the S&P 500 from 5,200 to 5,600 (+3% from current level) driven by softer-than-average negative earnings revisions and a higher P/E fair value multiple tall (from 19.5x to 20.4x).
NOTABLE GS PB…
4 Highlights from last week's PB data:
The HF L/S Global Fundamental Average is up +29bps for the week and is now +782bps year-to-date. L/S core gross leverage decreased 2.6 points to 192.0% (77th percentile for the year) and net leverage increased 0.8 points to 57.2% (97th percentile for the year).
Prime Book saw the biggest increase in gross trading activity in 2 months as global stocks were net bought on the week, driven by long buying outweighing short selling (1.2 to 1).
HFs net bought US Healthcare stocks for the third consecutive week and in each of the last 5 trading sessions, driven by long buying outweighing short selling (3.2 to 1). Last week's net buying in the sector was the highest in 6 weeks.
Industrials was the top net selling sector in the US Prime book last week, driven by short selling outpacing long buying (1.7 to 1). The sector has been net sold for 6 consecutive weeks and is now slightly net sold year to date.
The Healthcare sector now represents 18.6% of total US net exposure (up from 20.9% at the start of 2024), which is in the 38th percentile versus last year and in the 38th percentile 83 compared to the last five years. GS Prime Book is overweight Healthcare versus the S&P 500 Index by +6.8%, in the 73rd percentile versus last year and in the 94th percentile versus the last five years.

TRADING EVENTS: US MACRO CATALYSTS…
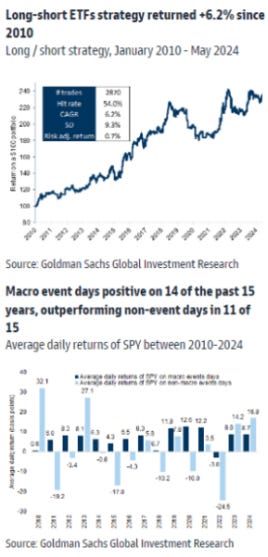
15-Year Study (Marshall) : Understanding Catalyst Returns and Identifying Cycle Inflection Points:
Track returns on macro catalyst days :
Understand its contribution to total returns .
Understand its impact on volatility .
Monitor trends in directional movements on macro catalysts .
We estimate annualized returns of +6.2% over the past 15 years positioning for a directional move in an ETF ahead of a catalyst, where that ETF has shown statistically significant directional moves on that same catalyst over the past year. [link]
Most significant catalysts currently :
FOMC Meetings
Productivity per hour in non-agricultural companies
Federal Reserve consumer credit have been the most significant events over the last year.
Most reactive ETFs :
XLP
FXY
Fixed income (HYG, IEF)
Internationals (EWG, EWU, VGK, FEZ) have had the most significant and consistent directional movements in macro catalysts over the last year.
Historical movements as a complement to future prospects : Our analysis is independent of a fundamental view on each catalyst and is therefore complementary to other macroeconomic models. We do not recommend investors trade solely based on the past without considering the likely outcome of the catalyst; however, we believe the model provides important historical context.
TMT SPECIALIST COLOR (CALLAHAN)
AAPL… Market talk lately is around Apple taking off, as fundamental sentiment and interest in the name continues to improve (both LOs and HFs), outperforming META in terms of investor optimism/confidence in this moment (and certainly more tactically relevant than MSFT and AMZN at the moment, IMO). The bull case is firmly anchored in a potential AI-driven renewal cycle (one can debate the 'timing' and investor patience/expectations regarding the fall'24 vs. fall'25 unit numbers), a more measured and 'light' on assets towards AI (at least measured by Capex compared to FAAMG peers) and also on the mathematically lower bar for a possible unit/AI increase (e.g. iPhone revenues have been stagnant in recent years). Although the stock's chart doesn't suggest much debate among investors, the short-term 'talking points' revolve around regulation (Google/TAC, App Store), expectations and valuation (the P/E multiple is quickly returning to multi-year highs), trends in China (and policies), the trajectory of gross margins given rising raw material costs (e.g., below-seasonal product gross margins in F2Q), and the possible pull and weakening of headlines/expectations in the 2H iPhone cycle.
Big Tech taking turns… MSFT was the latest Mag 7 name to take off last week (healthy debate over the “correct” interpretation of the ORCL report)… if it looks like these FAAMG+ stocks are taking turns taking off, it's because they are : META +25% in January/February… AMZN +15% in February… GOOGL +17% in March/April… MSFT +15% and AAPL +25% in May/June… (and yes, NVDA just went up throughout the year, except for April)... from here, it seems like most eyes are on AMZN for its potential breakout moment: the stock has stalled in this ~$190 range five times in the past few years.
Ducks on the pond (the ducks are calm when seen above the water, but their legs move frantically underwater)... further underscoring this “breadth” dynamic, the graph below from my colleague Brian Garrett illustrates that, in Compared to itself, the average stock in the SPX has been almost 4.5 times more volatile than the index itself (one of the highest in 3 years).
Market Performance
S&P 500: +77 basis points (bps), closing at 5473 with a Move to Close (MOC) of $2.7 billion for SELL.
NASDAQ 100 (NDX): +124 bps, closing at 19902.
Russell 2000 (R2K): +81 bps, closing in 2045.
Dow Jones: +45 bps, closing at 38,778.
Stock Volume: 11.2 billion shares traded across all US stock exchanges, compared to the year-to-date (ytd) daily average of 11.5 billion shares.
VIX: +71 bps, closing at 12.75.
Crude Oil: +260 bps, closing at $80.49.
10-year yields: +6 bps, closing at 4.28%.
Gold: -64 bps, closing at 2,331.
Dollar Index (DXY): -20 bps, closing at 105.34.
Bitcoin: -9 bps, closing at 66,407.
Topics of the Day
Today's themes were similar to Friday's with the NASDAQ outperforming modestly. However, market breadth was noticeably better today with 356 S&P 500 members participating in the rally. Overall market volumes decreased by 9% compared to the 20-day moving average (20dma).
There are many incoming questions about the increase. We are in a news vacuum right now, making it difficult to fight the current bullish trend. Get ready for some strange trading patterns this week with the holiday on Wednesday. It's worth noting that today is the first day of the corporate buyback blackout window. The systematic footprint is benign with $700 million of S&P on sale this week from the CTA community. We're keeping an eye on US retail sales tomorrow.
Portfolio Strategy
Our portfolio strategy team raised our year-end target for the S&P 500 from 5,200 to 5,600, but also presented a scenario that is raising some eyebrows: In a scenario of continued mega-cap exceptionalism, the S&P 500 Index would end the year at 6300 (+16%). Assuming a forward P/E of 16x for the equal-weight index and a 45% premium to the market cap index, the aggregate S&P 500 would trade at a forward P/E of 23x, 16% above today (89th percentile of 6-month returns).
Operations Desk Activity
The activity on our table was a 4 on a scale of 1 to 10. The overall executed flow on our table ended with a selling slope of -45bps today compared to the 30-day average of +188bps. Long/only traders (L/Os) finished as net buyers by +9%, driven by IT, macro, discretionary products compared to bidding in commodities. Hedge funds (HFs) finished as net sellers at -4.9%, driven by supply in macro, financial and information technology products versus demand in communication and industrial services.
Derivatives
Quiet start to the holiday week in volumes. Flows were generally moderate, but we saw a big tail trade when a GS client bought 20k x 100k of the VIX Dec 20-42.5 buy spread (selling 1 to buy 5). According to our model, we recover to peak SPX gamma today. We have traders with over $9 billion in gamma ahead of the quarterly expiry on Friday. Not much is expected for the VIX expiration tomorrow, as we close the day right between two strikes (12.5 and 13). Traders' crash position should clear up a bit as some VIX shorts roll over, although many of these shorts are in July rather than June. Morning retail sales are the next major economic data and the straddle is pricing in just a 0.45% move for the day.