Goldman Sachs: Trading Desk (01/10/2025)
In this challenging week, the RTY fell -3.5%, the NDX -2.2% and the SPX -1.9%, while the 10-year Treasury yield rose 16 basis points to 4.76%, and crude oil rose +3.7% to $76.60. The market is now pricing in only 33 basis points of cuts this year (compared to 85 basis points a month ago).
It was a week marked by a combination of firmer growth and persistent inflation (NFP and ISM services; GIR now expects two 25bp cuts this year vs. three previously), a sell-off following Jensen’s CES keynote, a hit to long-duration sectors with no real safe havens, uncertainty over a “Trump 2.0” (tariffs, TikTok, inauguration, geopolitics), a blackout period for corporate buybacks, and strong retail volume (explosive in sub-$1 stocks).
Investor sentiment ahead of the results appears “fair,” and the list of EPS configurations with debates or difficult scenarios appears longer than the list of clean configurations. Best sectors of the week: oil and sensitive commodities (+2-4%). Worst: CRE, ADRs, biotech and stocks with high short position (-4%).
From a flow perspective, long-term investors (LOs) ended up being net sellers of $1 billion, while hedge funds (HFs) were net buyers of the same amount. As expected, selling was concentrated in the technology sector, while financials, industrials and healthcare closed with net buying.
DERIVATIVES: The main story of the day shows that despite spot prices making new lows and breaking important technical levels, volatility is struggling to stay elevated in an environment of steeper slope and higher implied volatility. We have made roughly 2x the expected move by the straddle to the downside in a flatter gamma environment for market makers, and we are only seeing 0.2v increases in two-month fixed volatility. While not insignificant, it is very different from the strong correlation between spot and volatility we had seen over the past month. This reflects how the volatility slope has become so high that even large drops no longer have the same impact on implied volatility.
In terms of client flow, we have seen mostly monetization rather than more interest in optionality. We have seen clients rolling puts to lower strike prices and selling put spreads, both on SPY and QQQ. Interestingly, the curve is still struggling to invert dramatically despite the move made, with fixed volatilities for February and March fairly flat relative to each other. The team continues to prefer spreads over outright options with volatility at these levels and with plenty of early vol supply for the week ahead.
What to watch next week:
MACRO: China import/export data for December (Sunday 12/1), US PPI for December (Tuesday morning 14/1), US CPI for December (Wednesday morning 15/1; expect 20bp acceleration in headline to +2.9% yoy while core remains at +3.3%), South Korea rate decision (Wednesday evening 15/1), and China Q4 GDP and December Industrial Production/Retail Sales (Thursday evening 16/1).
RESULTS: Wednesday morning: C, BK, BLK, GS, JPM, WFC. Thursday morning: BAC, MS, PNC, TSMC, UNH, USB. Friday morning: CFG, RF, SLB, STT, TFC.
We also have two major conferences: ICR (1/13-15 in Orlando) and the JPMorgan Healthcare Conference (1/13-16 in San Francisco). Plus, Trump staff confirmation hearings: Tuesday (Hegseth and Burgum), Wednesday (Wright) and Thursday (Bessent).
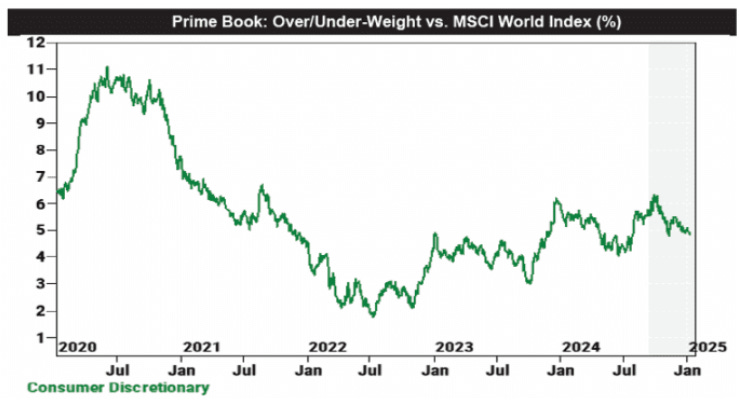
WEEKLY PRIME: US equities were net sold for the second consecutive week (three of the last four, -0.5 standard deviations on a yearly basis), driven by macro products and short selling outweighing long buying 2.5 to 1. Gross leverage in fundamental L/S strategies rose +3.3 points to 194.2% (89th percentile on a yearly basis), while net leverage rose +0.9 points to 56.5% (77th percentile on a yearly basis). Hedge funds sold consumer discretionary stocks for the fourth consecutive week and across nearly all regions. The sector weight of the main book versus the MSCI World ACWI is now at +4.83% (vs. +5.5% in early December), in the 25th/44th percentiles on a yearly/five-year basis.
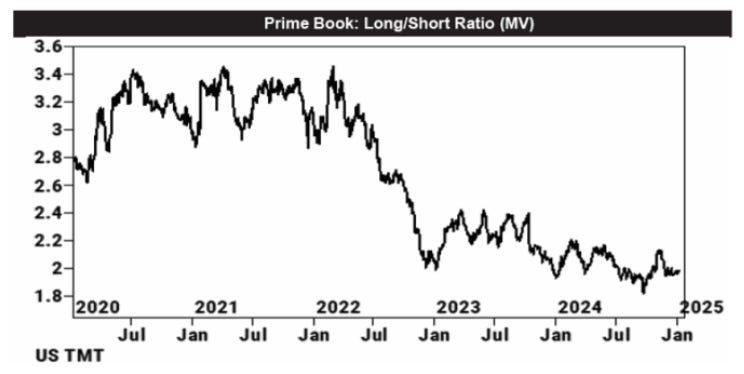
Managers bought US TMT (Technology, Media and Telecom) sector stocks at the fastest pace in 3 months, driven primarily by long buying. The US TMT sector long/short ratio now stands at 1.98, in the 39th percentile over the past year and in the 9th percentile over the past five years.