


Goldman Sachs: Tactical Cash Flow Analysis - September (08/12/2024)
a. This will be my last bearish forecast for the equity markets in August. We are finishing up the worst mismatch between supply and demand for stocks for August, and this is in the 8th inning of 9 in terms of a baseball game.
b. “I am so bearish on the global macroeconomic environment that I am tactically turning bullish on equities on August 30.”
c. “Are we there yet?” We’re not there yet, but we’re close and I’m starting to “test.” It’s expected that the continuation of the bid for action from systematic macro strategies may take until next week to fully clear. However, I’ve seen enough evidence and reduction in positioning to assert that the worst of the market’s technicals are behind us.
d. Positioning dynamics have completely changed since July 17th and are now starting to show signs of recovery following the deleveraging. Drawdowns of >5% – 10% occur >1x per year on average, so this reduction in positioning appears to align with historical patterns. August is always a tricky month and vulnerable to liquidity issues.
e. Thoughts on September? Positioning will be super clean to start a rally in September (Labor Day). I will be buying this dip in the first half and will alert you when it is all clear. I don't expect a retest of Monday's lows, however, it is time, not price, that will cause investors to start increasing leverage. Buyers remain at higher levels.
f. The most important stock on the planet in 2024, NVIDIA, reports earnings on August 28, and I have this post-market move marking the technical low for the index's biggest weights and AI favorites. I'm also watching the Jackson Hole Economic Policy Symposium on August 22/23, and there is some risk of being completely short on this event.
g. All eyes are on the CPI report on Wednesday, with the options strategy indicating a ~1.25% move, in my view, with more potential for downside impact than upside.
These are the top 10 points I'm following right now. It's time for a thread.
CTA
The systematic, rule-based leverage reduction of CTA strategies remains the most significant impact on the market in this period. Global stock futures worth $109 billion were sold in the past month, which is quite a lot.
In the next week: This is a red wave (only for the next 5 days)
a. Flat market: We have a global equity supply worth -$45 billion (or >$9 billion per day).
b. Bull market: We have a global equity offering worth -27 billion dollars.
c. Bear Market: We have a global equity offering worth -$68 billion.
Next month: Front-loaded supply, then shifts to neutral.
d. Flat Market: We have a global equity supply worth -$27 billion (~1 billion per day).
e. Bullish market: We have a demand for global stocks worth +89 billion dollars.
f. Bear Market: We have a global equity offering worth -$123 billion.
We just witnessed one of the biggest and quickest outcomes I have ever seen.
The GS Futures Strategy team estimates that global futures worth -$80 billion were sold in the last week and global equity futures worth -$109 billion were sold in the last month.
And -$109 billion worth of global equity futures sold in the past month.


II. Volatility Control
The GS Futures Strategies team estimates that current volatility control positioning is $140 billion. This has decreased by $33 billion in the past month, down from a record high of $173 billion. This is a reduction in exposure of -20% and adds to the systematic unwinding we have just witnessed.
Given the magnitude and scope of volatility strategies in 2024, this is important. The VIX index becomes a player on the field, no longer the coach from the sidelines. Volatility is QB1, not QB3. This statement could not be truer on Monday.

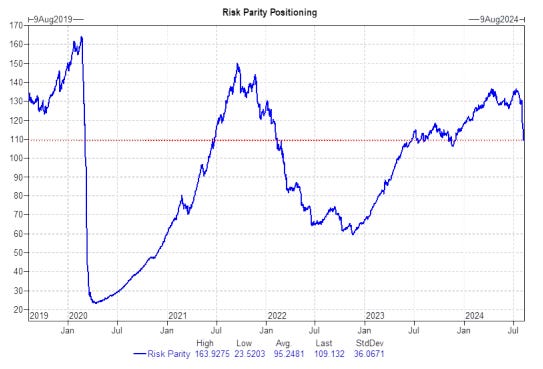
III. Risk Parity
The GS Futures Strategies team estimates current risk parity positioning at $109 billion. This has decreased by $21 billion over the past month, down from $130 billion. This is a decrease in exposure of -16%, partially offset by the rally in leveraged fixed income.
IV. Systematic Total
This is the most important line in this email.
Total exposure has actually OVERSPEEDED to the downside. I think given this type of behavior and explosion in volatility, it became a trend-based algorithmic move of “sell first, ask questions later” on Monday.

V. Liquidity
S&P 500 top-book liquidity (or the ability to transfer risk quickly…when needed) is currently at $5 million. This is down from $26 million in July. This is a -80% decline in the world’s most important equity liquidity instrument over the past 3 weeks.
Top-book liquidity hit $3 million on Monday, which was the lowest level since March 2023 (15 months). Additionally, ETFs accounted for 43% of total market volume on Monday, compared to 29% year-to-date, in addition to rebalancing of leveraged ETFs at the end of the day.

VI. Short Gamma
Gamma is no longer a market dampener, it now exacerbates the volatility cycle (in both directions). The VIX saw the largest spike since February 5, 2018 (i.e. Volmageddon) last week, and volatility shorts continue to unravel. Market makers have been shifting their exposure more quickly than in the past.
The GS Futures Strategy Team estimates the current short gamma position is -$2 billion for every 1% of the S&P 500. This is a dramatic change from a record +$16 billion in long gamma last month. Traders are getting long gamma on the upside and more short gamma on the downside. I don't see index desks getting significantly long gamma in the near future.

VII. Companies
The August-September corporate repurchase window is historically strong. This two-month period is the second-best of the year with 20.7% of executions (only November and December are higher, at 21.1%). GS estimates corporate repurchase authorizations worth $1.15 trillion and executions worth $960 billion.
We currently estimate that 90% of the S&P 500 is in the open window and it closes again on September 6th. Companies are likely to take advantage of this drop, with daily buying power of $4.75 trillion until the window closes. (
960 billion×20.7%)/42 days)(960 \text{ billion} \times 20.7\%) / 42 \text{ days}) ( 960 billion × 20.7% ) /42 days )

VIII. Feeling
Sentiment has changed and “markets in crisis” is mainstream.
a. The percentage of “bulls” in the AAII sentiment index fell 17% over the past two weeks. This is the largest two-week drop in bulls since 1987.
b. Retail sentiment indicators are showing fear (e.g. CNN's Fear and Greed Index is at the highest level of fear since October 5, 2023).
c. Even retailers switched to buying put options on Monday. Options have seen the highest volume on record with 73 million contracts. The most important dynamic is that 0DTE option volumes have shifted towards put options. 3.3 million S&P 500 put options were traded on Monday, also a new record. This was something new.

IX. Unraveling “Electoral Operations”
For the first time, Kamala Harris is leading Donald Trump. At one point, prediction markets showed a lead of more than 10% for Donald Trump.
Given the virtual tie among forecasters, the “red wave” electoral operations have been undone.
Two charts for a visualization (Trump vs. the S&P) and (Harris vs. the VIX). We should expect a choppy trading environment heading into the election; however, positioning has been reduced in those early election trades.
Institutional managers now need to cover different scenarios from the LP/management side, given the readjustment of probabilities (which was not the case in June).


X. September Season
a. The second half of September is the worst two-week period of the year. Seasonal factors have aligned remarkably well in 2024, sometimes to the exact day.
b. Companies are again in the restriction window starting from September 6.
c. Pension funds will sell more equity exposure and move into fixed income as funding status has massively increased given the decline in global bond yields. (This quarterly rebalancing is usually important, especially given the circumstances.)
d. My forecast for the rebound will focus on the first half of September.
e. Passive/dated/retirement flows, in my view the biggest driver of flows, fill in October for a Q4 rally but are fairly flat through September unless we bounce materially.
f. My direction from here is that we can bounce back up, but we won't really have a clear uptrend until Q4 and a post-election rally.

Conclusion on the direction to follow from here:
There is a short-term window to buy the dip as technical pressure eases.
The second half of September will be a challenging trading environment (especially before the elections).
New highs in the fourth quarter, led by the months of November and December.
Have a great trading week and let me know how I can be of help.
“All references to “we” refer to the opinions and observations of the table.