


Goldman Sachs: OER You Serious - The January Effect
We expected and indeed received a large “January effect” in last week’s price data, with CPI and PPI both surprising consensus to the upside. In our view, the bigger surprise was the 0.56% spike in owners’ equivalent rents (OER), which outperformed the primary rent measure by the most since 1995. In this edition of the Analyst, we explore the scope for OER to continue to outperform and the implications of the January price data for the inflation and policy outlook.
In principle, the rebound in the single-family housing market and the unaffordability of homebuying could drive a positive wedge between OER and rent growth. Exploring this possibility using Zillow, Yardi, and Corelogic data, we find that the outperformance of single-family rent growth is fairly moderate—around +2pp annualized—and we estimate that this gap explains less than a quarter of the January OER spike. Simply put, January OER rose 7% in annualized terms but single-family rent growth is running at less than half that pace. We also do not find a clear relationship in the city-level cross section between January OER and single-family home price appreciation.
We believe single-family housing strength is a reason to expect OER to outperform rent CPI this year, but by nowhere close to 20bp per month. We assume a 4bp monthly boost to OER from this channel over the remainder of 2024, and we are boosting our December 2024 PCE housing inflation forecast by 0.4pp to 4.3% (yoy).
We are not too concerned about the strength elsewhere in the January CPI and PPI reports. January price changes tend to be cyclical and volatile—what we call the “January effect”—and usually, sequential inflation slows back down in February. We had already assumed a January effect in healthcare—where the lag between costs and prices is particularly long. Additionally, 3- and 6-month trimmed inflation remained rangebound in January, despite a boost from the January effect. Taken together, we are boosting our 2024 core PCE forecast only modestly, by 0.1pp to 2.3% (December yoy).
The January FOMC statement indicates that rate cuts will likely commence once inflation is moving sustainably toward 2%. If inflation evolves as we expect, core PCE inflation would fall to 2.5% at the time of the May meeting, and participants would likely anticipate further declines over the next two months given the high base effects in mid-2023. Accordingly, we continue to forecast five 25bp cuts in the Fed funds rate this year, with the first cut at the May meeting. This being said, last week’s price data raise the stakes for the February CPI and PPI reports to confirm that the January jump in OER and non-housing services were both temporary.
OER You Serious?
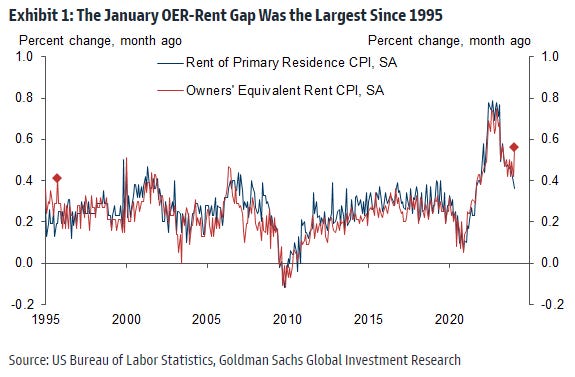
The January CPI report received a large boost from start-of-year price adjustments—what we call the January effect. Because we were expecting a temporary boost from this channel, the bigger surprise for us was the spike in owners’ equivalent rents, which represent 34% of core CPI and 13% of core PCE. Despite being calculated from the same source data as the primary rent CPI, due to imputations and re-weightings, the owners’ equivalent rent (OER) category jumped 0.56% in January, outperforming the primary rent measure (+0.36%) by the most since 1995. In this edition of the Analyst, we explore the scope for OER to continue to outperform, and we search for broader implications of last week’s price data for the inflation and interest rate outlook.
A Spike in OER
The largest component of the CPI—owners’ equivalent rent, or OER—tracks a price that nobody pays: an imputed rental payment from homeowners to themselves. After this category did not mirror the surge in home prices in 2021 and 2022, the Bureau of Labor Statistics (BLS) revamped the CPI methodology in January 2023 to increase the weight on rents of single-family houses.
As shown in Exhibit 1, OER spiked 0.56% in January, a nine-month high and its largest gap versus the primary rents component since 1995. Leaving aside the question of how the inflation statistics should treat owner-occupied housing, the large OER weight in core CPI (34%) and core PCE (13%) implies a potentially large boost to measured inflation if this gap were to persist later in 2024. Illustratively, OER outperformance contributed 7bps to monthly core CPI inflation in January, which in annualized terms adds +0.8pp to core CPI inflation and +0.3pp to the core PCE measure. Put another way, a persistent OER-rent gap of the size seen in January could potentially determine whether core PCE returns to target later this year or remains in a 2.3-2.5% range on both an annualized and year-on-year basis.
Because homeowners pay directly for utilities but tenants generally receive some services pre-paid as part of their rental agreement, the BLS imputes and removes utility costs from the OER index. We doubt this imputation explains the January OER spike for the simple reason that utility prices are rising—and that uptrend implies downward pressure on OER. The January effect is also a poor explanation for the OER jump, because most rent prices do not adjust in January.
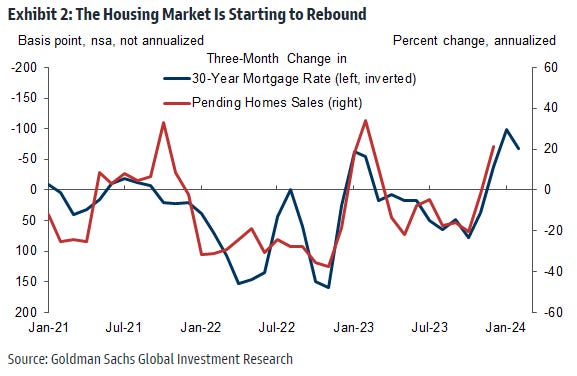
This raises the risk of a more fundamental and persistent driver of the January OER acceleration, and the most obvious candidate is the nascent rebound in the housing market and the large affordability gap between buying and rent—because the cost of financing a home far exceeds the cost of renting, potential home buyers are forced into the rental market at a time of very low supply. As shown by Exhibit 2, the 1pp pullback in mortgage rates since the autumn has contributed to a 21 percent annualized rebound in pending home sales over the last three months. Home prices are also now rising again at a roughly 5% annualized pace (Case-Shiller, 3-mo ar, not shown).
Alternative Data on Single-Family Rents
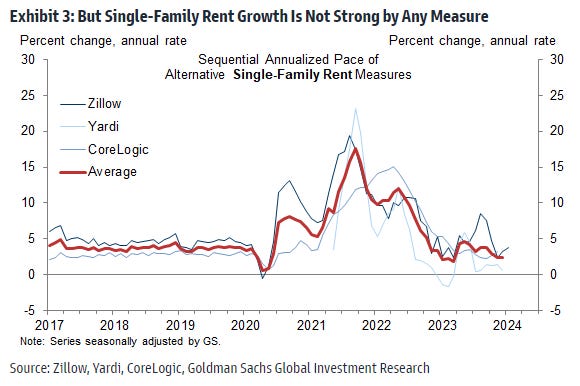
While home price growth does not directly enter the CPI, it nonetheless boosts measured inflation to the extent that it spills over to the rental market—particularly for the OER subcategory that overweights single-family neighborhoods and (since January 2023) overweights single-family units. In Exhibit 3, we create a composite measure of single-family rent growth combining three higher-quality series. We find that the monthly annualized growth rate of these measures has slowed from a peak of almost 18% in late-2021 to roughly 2-3% on average in recent months, arguing against a sharp pickup in new-lease single-family rent growth that might explain the January spike in OER. More simply, January OER rose 7% in annualized terms, but single-family rent growth is running at less than half that pace—and OER also includes a multifamily segment for which rent growth is even lower.
As an additional crosscheck for whether a hot housing market might have contributed to the pickup, we review the city-level cross section in the CPI data. Exhibit 4 shows that the January pick-up in OER was led by smaller metros: OER accelerated by more in Class B and C cities (those with populations less than 2.5mn) than in Class A cities (those with populations of 2.5mn or more).
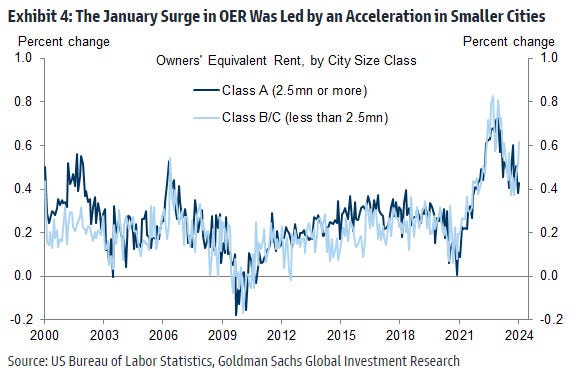
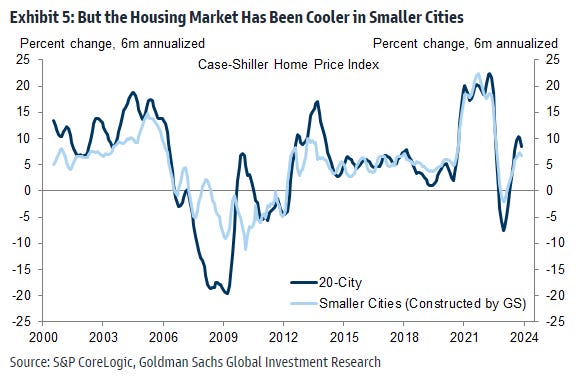
If a hot housing market were the source of the acceleration in OER, we would expect home price growth to be hotter in those cities. We find the opposite: home price growth in smaller cities has been running slightly below that of large cities over the last 6 months, as shown in Exhibit 5.
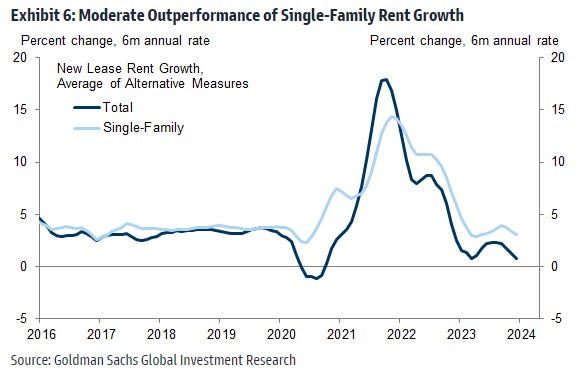
While quantitatively unsatisfactory for January, the outperformance of single-family rent growth does argue for OER to run modestly hotter than primary rent inflation going forward. As shown in Exhibit 6, we find that single-family rents have been and are currently rising roughly 2pp faster than the broader market.
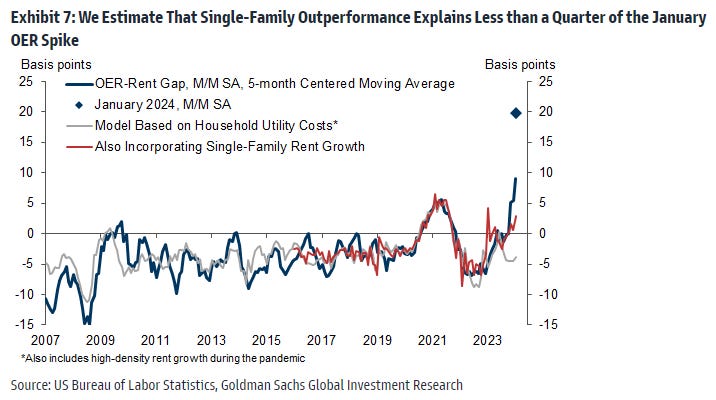
In Exhibit 7, we model the monthly inflation gap between the OER and rent CPIs using household utility prices and using the outperformance of single-family rent growth (shown previously in Exhibit 4). We allow the coefficient on single-family rents to evolve in the month of January 2023, concurrent with the BLS methodological change that increased the weight in OER on single-family units. As shown by the red line in Exhibit 7, we estimate that single-family outperformance can at most explain a quarter of the January OER spike. It would also be odd for a methodological change implemented in January 2023 to produce a sustained increased in monthly inflation starting in January 2024.
Our analysis argues against a 20bp step-up in the monthly OER trend caused by single-family housing strength. Looking ahead, we instead assume a +4bp boost to the monthly run-rate for the remainder of 2024, relative to our previous estimates, though we also assume a third of the January spike reverses in July when the January subset of the CPI rent is next surveyed.
Reflecting the January OER spike and our +3bp upgrade to the pace of overall shelter inflation (the rent subindex is unaffected) in most other months in 2024, we are boosting our December 2024 CPI and PCE housing forecast by 0.4pp to 4.3% year-over-year. We are also boosting our assumptions for the upcoming core CPI readings to +0.27% for February and +0.25% for March, up from +0.21% and +0.22% previously).
Non-Housing Services Inflation and the January Effect
Last week’s CPI report also received a large boost from start-of-year price adjustments—what we call the January effect. However, we are not making significant changes to our sequential inflation assumptions in affected categories, primarily because the January effect was already embedded in our forecasts.
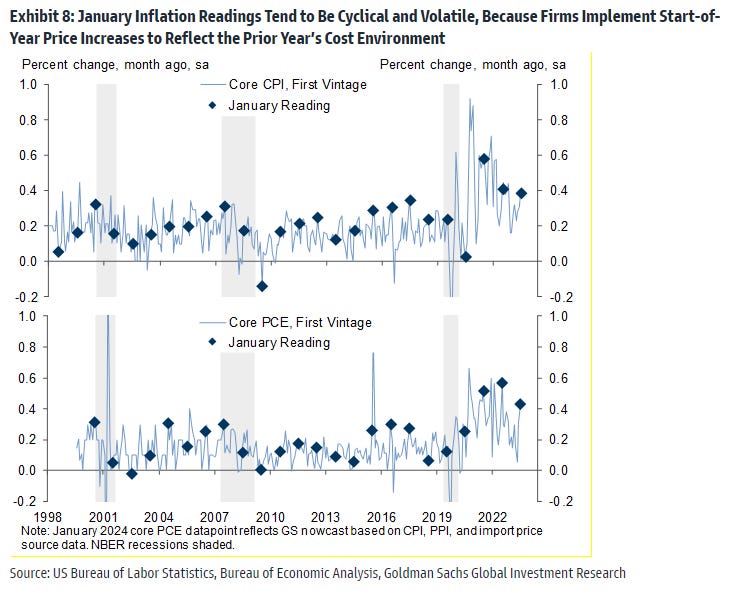
The month of January is particularly important for inflation data, because many labor and supplier contracts are reset or renegotiated in that month. This effect manifested in several labor-reliant services categories in January 2024, and in our view reflects a catch-up in prices to the upward cost pressures of 2023. As shown in Exhibit 8, January price changes tend to be cyclical and volatile, and in most past instances, sequential inflation reverses large January moves in February.
Healthcare prices were one of the stronger non-housing services segments—both in the CPI and PPI data. In our 2024 Inflation Outlook, we highlighted healthcare as one category where pent-up cost pressures would likely lead inflation higher, due to particularly long lags in that sector. This pent-up cost pressure evidently materialized in the January source data, as shown by our nowcast of healthcare services PCE in that month (see blue line in Exhibit 9).
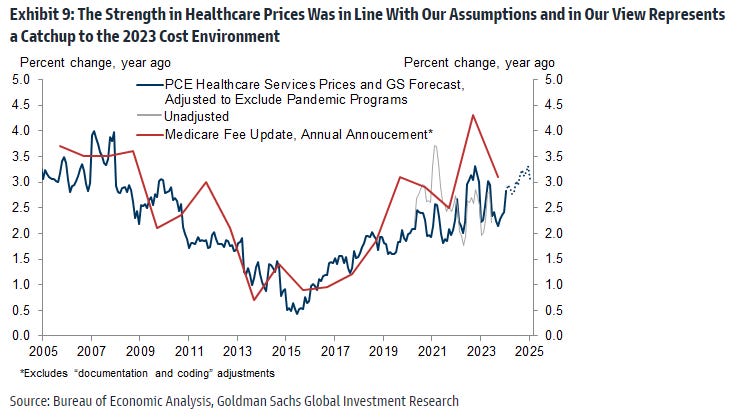
We continue to expect healthcare services inflation to rise to 3.2% year-on-year in December (see dotted line in the same exhibit), followed by a decline to 2.7% in 2025 as the cost environment normalizes further.
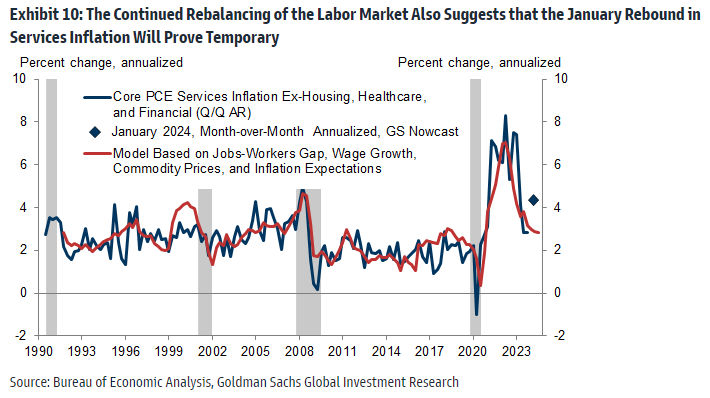
More generally, the January price gains in non-housing services screen as an outlier relative to their key inflation drivers, as shown by our model (red line in Exhibit 10).
We were also encouraged by the fairly modest pickup in 1-month trimmed core PCE inflation and by the rangebound readings for 3- and 6-month gauges (see Exhibit 11).

In some sense, the sequential price strength in January confirms last year’s cost pressures, which are a fairly undisputed feature of the economy in that period. Under that interpretation, the January price data may tell us little about the sequential pace of inflation for the remainder of 2024. Taken together, with the January CPI and PPI reports in hand we are boosting our 2024 core PCE forecast only modestly, by 0.1pp to 2.3% (December yoy).
Fed Implications
As shown in Exhibit 12, our updated forecast for 2.65% year-on-year core PCE in February remains above the threshold to begin the easing cycle at the March FOMC meeting.

Looking further ahead, we believe our forecasted decline to 2.5% for March—which the Fed will have in hand at the May meeting—is consistent with a rate cut at that meeting as long as the sequential readings in February and March are sufficiently soft and the year-on-year pace looks likely to decline further.
The January FOMC statement indicates that rate cuts will likely commence once inflation is moving sustainably toward 2%. Fed Chair Powell noted in December that this easing should occur “well before” year-on-year inflation reaches that level, however the FOMC reaction function may have shifted since then given that Powell has not repeated this "well before" comment recently and given the omission of the 6-month annualized rate from recent Fed communications.
If inflation evolves as we expect, core PCE inflation would fall to 2.5% at the time of the May meeting, and based on high base effects in mid-2023, we’d expect the Fed staff to project further declines in subsequent months. We continue to forecast five 25bp cuts in the Fed funds rate this year, with the first cut at the May FOMC meeting. This being said, last week’s price data raise the stakes for the February CPI and PPI reports to confirm that the January jump in OER and non-housing services were both temporary.
-Spencer Hill, Ronnie Walker
