


Goldman Sachs: Notes (Pasquariello) 05/10/2024
First quarter earnings impress. Compared to both expectations and trend, the reporting period has objectively brought a clear story of corporate strength: 60% of S&P companies outperformed at least one standard deviation (historical average is 51%), while that only 10% failed (the historical average is 12%). While we can debate the price action here and there, the fact pattern is that many of the country's largest stocks reached higher highs in their respective prints.
Thanks to the big tech companies. Without a doubt, its contribution to the statistics from the previous paragraph has been immense: earnings growth for the S&P in the first quarter is tracking at +6% year over year... within that, the seven big stocks are at + 48% year over year… and the other 493 are at -2% year over year. To be clear: +6% for the market, +48% for the big 7 and -2% for the rest. Furthermore, the biggest of the big continue to demonstrate their considerable strength on two key fronts: capital return (remember last week's buyback stats) AND capital reallocation (see next point, it's notable).
Reinvestment of big technology companies. Here's the market valuation: Total capital + R&D spending for the Big Seven this year is expected to reach... $348 billion (think about that for a moment). Here's another way to frame it: The Big Seven reinvest 61% of their operating free cash flow into capital + R&D... that tracks 3x as much as the other 493. As the great Mike Bloomberg would say, "Stop me when you're going." getting bored of this.”
The Fed This week's round of speeches hasn't changed my main impression from last week's FOMC meeting: the right tail of the policy rate distribution is not yet in play; While the threshold to delay cuts is low, the threshold to increase is very high. So let's see what today's comment brings up, but it seems like their intention is to sit still and do nothing until the data set forces a move (again, I suspect 5.375% is where the turkey will roast a little more , while QT is being markedly reduced).
The podcast. This is a conversation with Jan Hatzius, where we touch on all the hot spots: growth, inflation and the Fed. What catches my attention is his conviction that the general trend of disinflation remains intact: link.
Volatility in stocks. I think the macro backdrop is consistent with the recent compression in implied prices (although admittedly I'm surprised at how quickly this has developed; note that the UX3 contract is hitting year-to-date lows, tilt has been crushed, and volatility is clearly being supplied). With some thanks to the rates market, I consider this a really GOOD development, as you can once again execute the play that worked SO well in the first quarter: hold positions where you have a true belief, and rent short-term puts to protect you against event risks along the way (for example, next week's CPI).
The American consumer. As usual, the reporting period brings something for everyone… consider the tension between what we hear about spending at restaurants (see MCD, SBUX) versus cruise lines (see NCLH, RCL). While I have respect for opposing arguments given some local pressures, I still think the American consumer is doing well: we are creating about 250 thousand jobs each month... real household incomes continue to rise... the stock market is a good day away from reaching an all-time high… home prices are at all-time highs… and household balance sheets are very healthy.
The big picture is US nominal growth. After three fiery years, we forecast nominal GDP growth of 5.5% by 2024, which compares favorably with the average rate of just 3.8% from late 2008 through 2020. While this may present an upper-class challenge to the stock market — above-trend output is still tinged with above-trend inflation — I feel strongly that it invalidates some recent calls for stagnation, and I will remind myself that Stocks are REAL assets that claim NOMINAL growth.
Fund flow/positioning. The big players are favorable: (1) the hedge fund community — both systematic and discretionary funds — are sitting high and, if anything, have become buyers again; (2) the retail crowd remains in buying mode, modestly but steadily; (3) the buyback window is wide open for companies with more dry powder (we expect average annual buybacks of $1 trillion in 2024 and 2025, this is the highest technique in the market). Here's how I translate all of that: On a scale of -10 to +10, I'd put the current position at +7... although clearly elevated, I would have said the same thing all year, and it hasn't hindered progress yet.
I like gold. Despite a recent pullback, the yellow metal has been a strong asset this year, with a Sharpe ratio of 1.6. I suspect much of this is a demand story, especially in China, both from the central bank and from households. Here is the bigger picture and the official view, which still expects a considerable increase until the end of the year:
USA vs. ROW. While I recognize the YTD score, where the “underdog” parts of the global equity complex have seen a clear rebound (HSCEI, surprising), this is an expression I've been hearing a bit recently: “U.S. "The US invents, China produces and Europe regulates." For an interesting read from a client: [link].
Mega capitalization vs. small cap. Last year, the Magnificent Seven outperformed the Russell 2000 by a factor of 6 times; Although I loved the former and not so much the latter, I didn't think that level of performance was sustainable. Well, to keep things straight, here's the 2024 YTD score: GSMEGTOP +18%… RTY +3% (see point #19 below, longer time series, same result).
Playoff hockey. I'm not a Bruins fan; I'm not a Rangers fan. However, I'm looking forward to that matchup in the next round, as the Boston/New York sports rivalry is the best in the country.
While I fully recognize that the placement on this exchange is not what it was at the beginning of last year, a strong argument can still be made that the outperformance of US mega-cap tech stocks has been fully justified by their outperformance. earnings performance... which is captured well in this exact chart, thanks to Peter Oppenheimer (what you see is indexed to trailing 12 month EPS).

To revisit another recent topic, this plots the difference between the US budget deficit, expressed as a % of GDP, and the unemployment rate (thanks to Lexi Kanter). As you can see, there has been considerable normalization since the peak of COVID. That said, we're still WAY above normal, especially considering we're not at war:

an update on the IG expiration wall (link). Unlike the previous graph, I don't find this as intimidating. If anything, there is a very strong argument that the private sector, both businesses and households, did a much better job of bringing their debt to term than the US Treasury Department.

Following on from last week's article on the impressive demand for energy from global data centers (link), take a look at the recent price action in our “Power Up America” basket… this is the best-of-breed themed basket performance on my dashboard, has been justified by earnings growth and I believe it is structural:

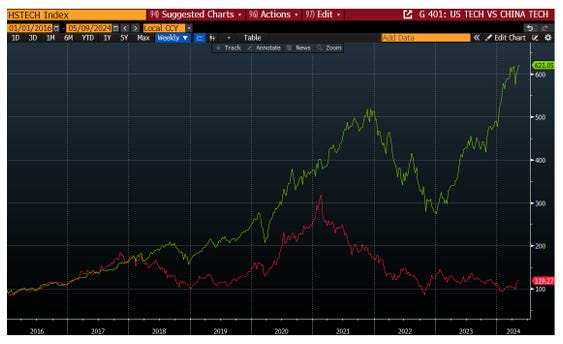
The big ball. While I fully recognize that China has seen strong growth in recent months, I want to revisit this long-term chart, which illustrates US tech stocks (green) versus China (red):
NDX vs RTY in the post-Global Financial Crisis era. This table speaks for itself (thanks Jenny Ma). Behold the power of compound interest:

Some footnotes to close the email:
Regarding the Mag 7's EPS growth versus the field, Ben Snider notes: “The median SPX stock is tracking EPS +7%. The M7/493 stats can sometimes be interpreted as only mega-cap tech stocks growing earnings, and that's not the case. But the data is clear as to its weighted contribution to the aggregate total.”
As The Daily Shot noted, April marked the — ahem — 40th consecutive month of job gains over 100k.
I'm also hoping for a Celtics/Knicks series at the exact same time as Bruins/Rangers.
Finally, returning to the chart on the supremacy of US mega-cap tech stocks, I'll repeat a quote from my first email of 2024... I still believe in all of this: Is US mega-cap tech? a consensual position? Of course. This is a problem? Not necessarily. Here's how I think about it: Capital has been piling into US tech stocks for a long time (and it's been piling up for all the right reasons). That leaves us with a set of stocks that are very well owned and highly valued. As we have seen in recent years, this can lead to periods of significant underperformance. Additionally, the law of large numbers raises some questions about market cap appreciation from here. However, when you take a step back, I would argue that these are the best balance sheets on planet Earth… they are generating and returning an immense amount of capital… and they have the most direct leverage on the hottest new issue. Furthermore, the outperformance of these stocks was fully justified by their superior earnings growth. Finally, don't forget that FANG was consensus for years, and that certainly didn't get in the way of an exemplary performance. Where I get there: These stocks are not cheap and are widely held, so one should be a bit selective when adding length here; In the bigger picture, however, I'm inclined to keep my focus on target and look to add on significant dips.