Goldman Sachs: January Effect and Flows
Corporate Buyback Execution Projections
The corporate buyback window opened on Monday, with approximately 28% of the corporate window currently open. By next Monday, this figure is expected to rise to 45%, reaching 60% by the end of next week (July 2). As corporate demand increases, this dynamic is expected to have a significant impact on market liquidity and price action.
Goldman Sachs Corporate Operations projects a record $1.16 trillion in corporate buyback executions for 2025, inclusive of S&P 500 and Russell 3000 constituents. Given 250 trading days in the year, this equates to an estimated $4.64 billion in daily executions on average, with fluctuations based on window activity:
~$7 billion per day during open windows
~$3 billion per day during closed windows

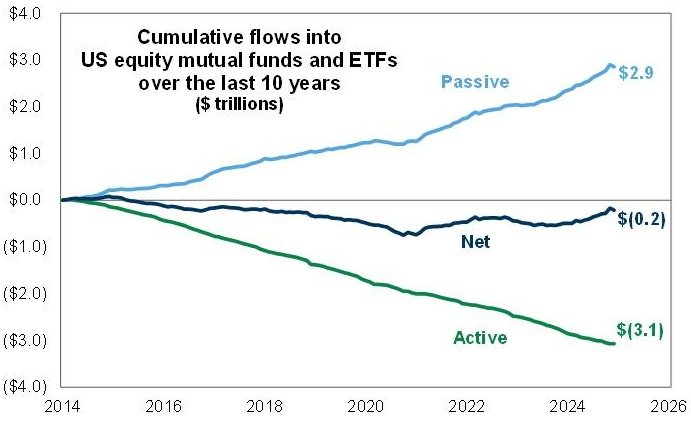
Seasonality and Capital Flows
Historically, seasonal equity market strength extends through mid-February based on data dating back to 1928.
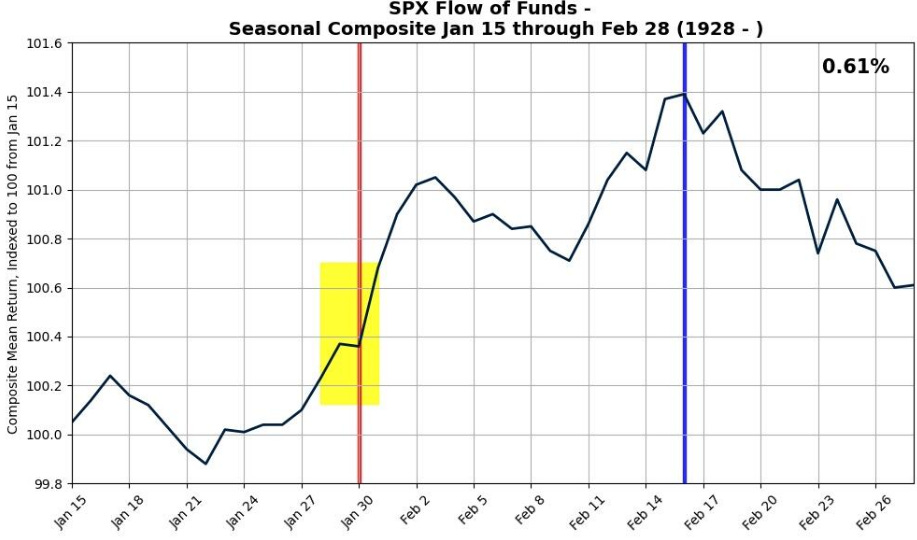
The January effect remains a key driver, though these flows are expected to moderate by early February.

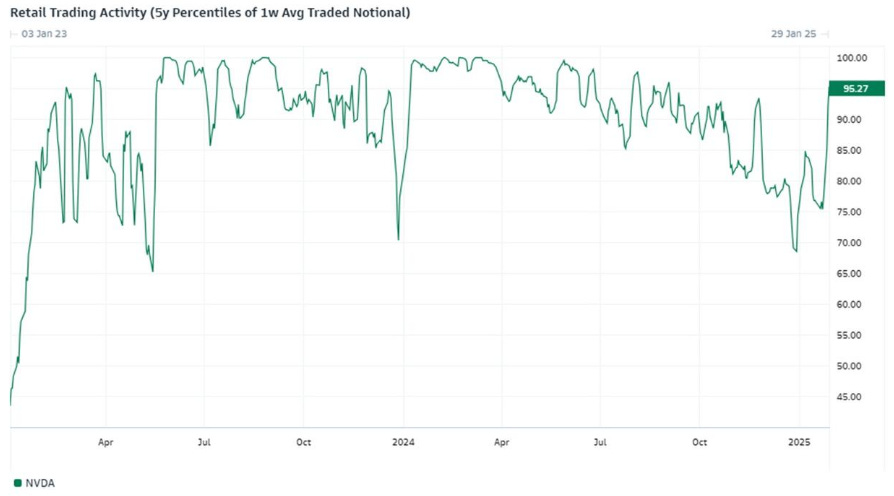
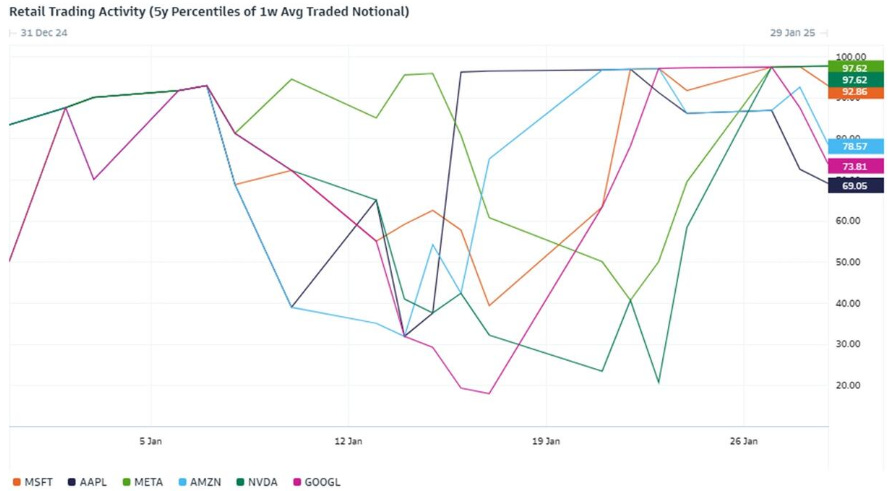
Additionally, retail investor activity has surged, with notable demand observed in QQQ ETF purchases following recent market dips.
Investor Sentiment and Risk Appetite
The Goldman Sachs Risk Appetite Indicator remains at elevated levels, reflecting increased speculative activity:

Leveraged ETF trading volume has spiked

Options market activity, including 0DTE contracts, continues to rise
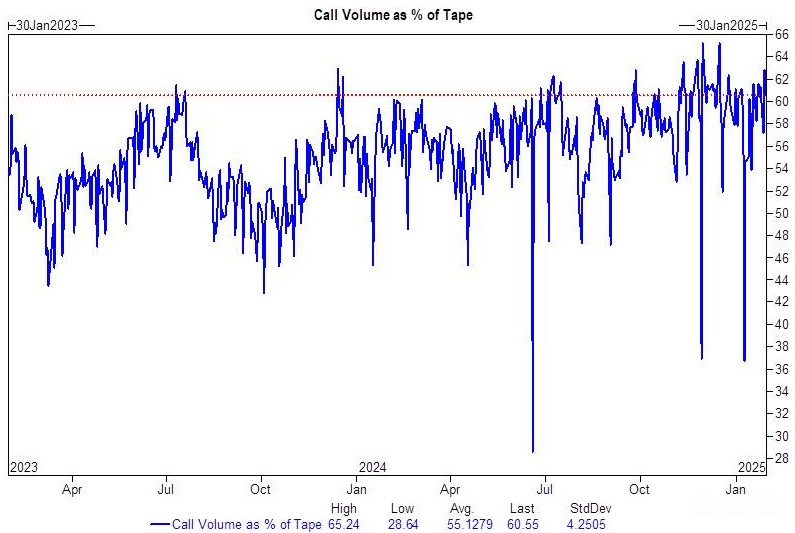
5-year retrospective positioning indicates persistent investor demand
Systematic Flows
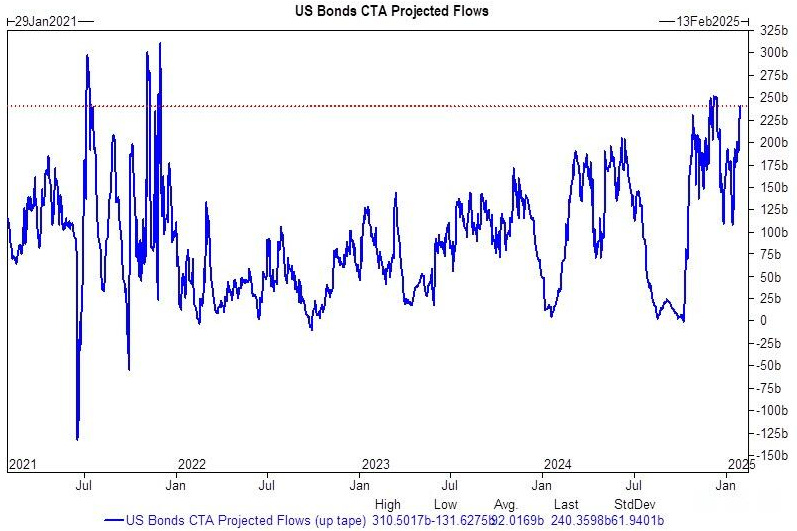
Bond CTA positioning remains skewed toward the buy side amid declining yields. Over the next week, CTA flows in government bonds (DV01, as of January 30, 2025) are projected as follows:
Flat market: $7.23mm net buying ($7.03mm in US Treasuries)
Rising market: $23.84mm net buying ($14.64mm in US Treasuries)
Declining market: $1.07mm net selling ($2.03mm in US Treasuries)
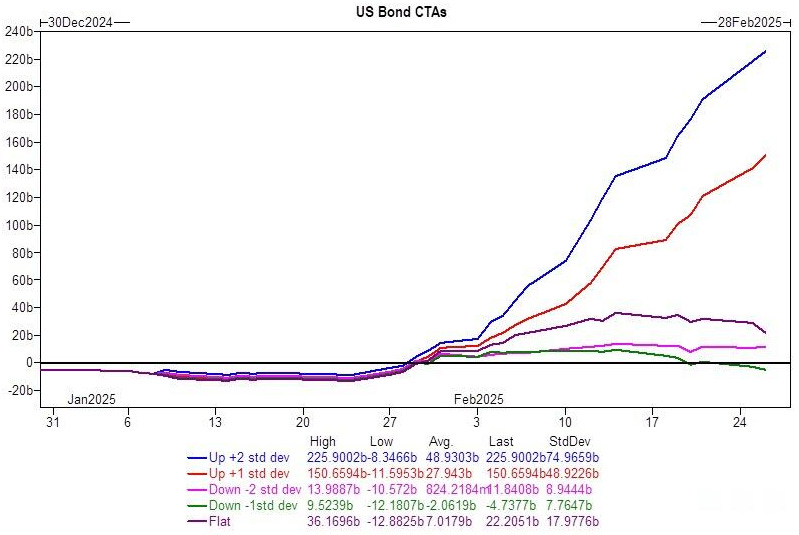
For the next month, the projections shift toward more significant buying pressure in an upward-trending market.
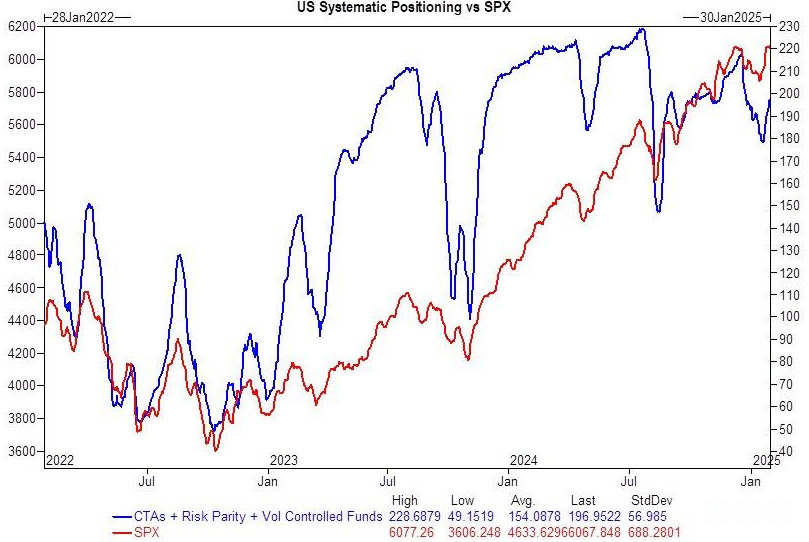
Similarly, systematic CTA equity flows remain supportive of risk assets. As of January 30, 2025, projected flows are:
Next week:
Neutral market: $18.94 billion in net buying ($6 billion in the US)
Rising market: $19.87 billion in net buying ($5.96 billion in the US)
Declining market: $8.14 billion in net selling ($6.47 billion outside the US)
Next month:
Neutral market: $18.93 billion in net buying ($1.98 billion in the US)
Rising market: $54.99 billion in net buying ($13.31 billion in the US)
Declining market: $175.57 billion in net selling ($59.87 billion outside the US)
SPX Key Levels:
Short-term: 5,996
Medium-term: 5,828
Long-term: 5,353
Market Leverage and Liquidity Trends
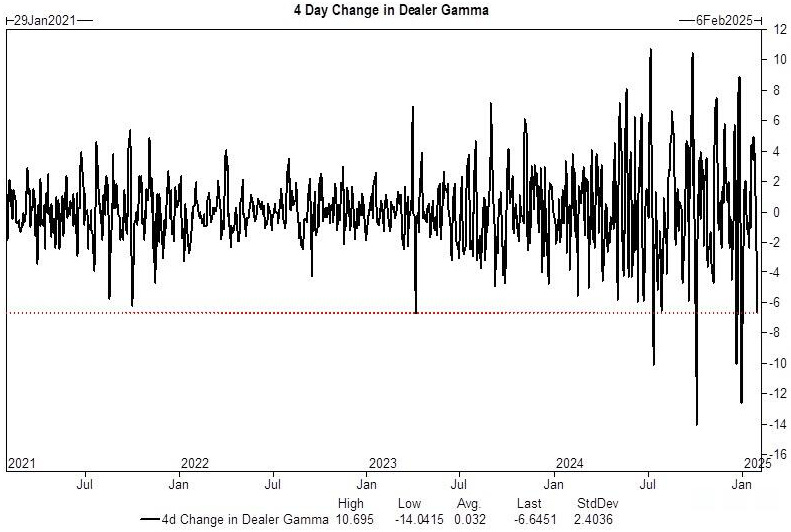
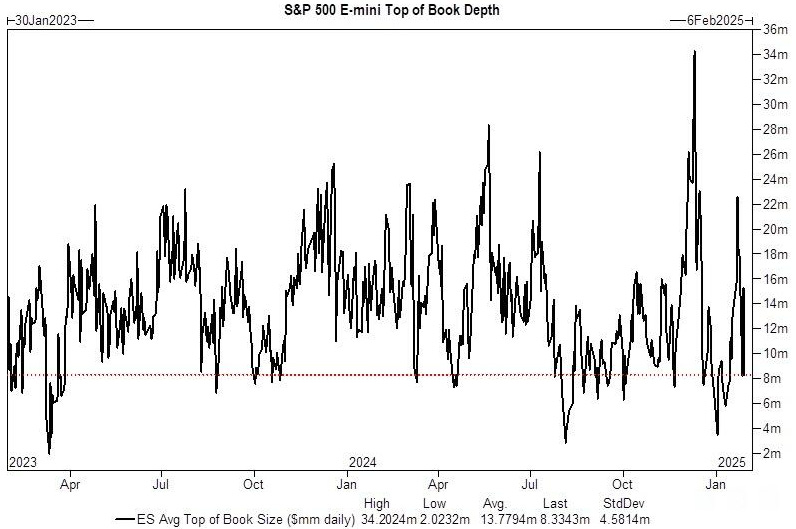
Funding spreads indicate a reduction in market-wide leverage, particularly among professional and systematic investors. Additionally, gamma positioning has declined, leading to reduced market cushioning and lower liquidity, which may increase intraday volatility and price swings.

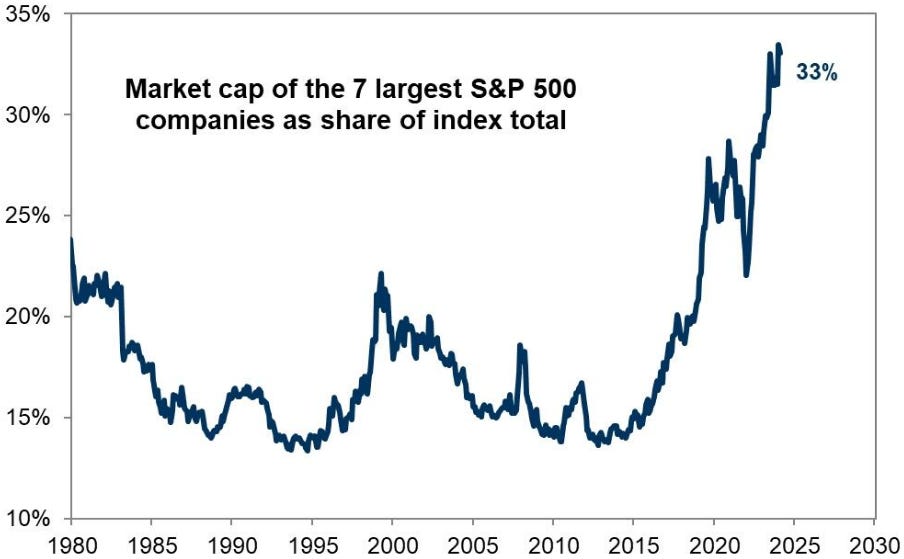
Structural Market Themes
Market positioning among “Magnificent 7” stocks continues to be a key driver of performance.