


Goldman Sachs: AI - To buy, or not to buy (Global Strategy Paper 70)(09/05/2024)
The technology sector has generated 32% of the Global equity return and 40% of the US equity market return since 2010. This has reflected stronger fundamentals rather than irrational exuberance. The tech sector globally has seen EPS rise c.400% while all other sectors together have achieved c.25% from the peak pre-GFC.
The introduction of transformative technologies typically attracts growing investor interest as well as significant capital and new competition. As enthusiasm builds and stock prices increase, the sum of individual company valuations can overstate the total potential aggregate returns; often a bubble develops and bursts.
Historically, investors over-focus on the originators, understate the impact of competition and overstate the returns on capital invested by the early innovators. At the same time, investors tend to underestimate the growth of new entrants to the industry that can piggyback off the capex of others, enabling them to generate new products and services. Valuations often also understate the opportunities that can accrue in the non-technology industries that can leverage the technology to generate higher returns in existing, as well as in new, product categories.
In our view, the technology sector is not in a bubble and is likely to continue to dominate returns. However, concentration risks are high and investors should look to diversify exposure to improve risk-adjusted returns while also gaining access to potential winners in smaller technology companies and other parts of the market, including in the old economy, which will enjoy the growth of more infrastructure spend.
Tech’s Rational Exuberance
Technology has been the most important driver of returns for the equity markets globally since the end of the Global Financial Crisis. Its performance has far outstripped other major sectors, and with good justification. Earnings per share have surged while all industries together, outside of tech, have largely stagnated (Exhibit 1).

Increasingly, these powerful returns have been accounted for by a small group of dominant companies, mainly in the US. These, too, have not reflected ‘irrational exuberance’: their earnings growth has dwarfed that of the broader market, justifying their performance (Exhibit 2). The drivers of this success have reflected their ability to leverage software and cloud computing and to fuel high profitability generated by extraordinary demand growth in the period since 2010. But their more recent surge in performance since 2022 owes much to the hopes and aspirations around AI. Despite continued powerful earnings growth, valuations have been rising, led by an increasingly narrow group of ‘hyper-scalers’. The question for investors is whether this is becoming a bubble and, even if it is not, whether the risks of such high concentration are creating a dangerous trap for investors, or possibly an opportunity to diversify into potential beneficiaries of these technologies through cheaper companies outside of the dominant few. Story Time Financial markets reflect and anticipate fundamentals, but sentiment can also play an important role as it does with other fashions and trends in broader life. In equity markets, narratives have the power to attract and direct much-needed capital. However, they can also amplify interest to the point of monopolising investor attention at the expense of other opportunities, and leading to unrealistic expectations about future profits and leaving companies vulnerable to a sharp de-rating. In recent years, periods of intense speculation have centered on a variety of narratives, ranging from the dot-com and the internet boom at the end of the last century, to China growth, Cryptocurrency, the Green transition and, most recently, AI. But history reveals a much longer list, much of which revolves around the emergence of new technologies. The interest that new innovations receive has been an important part of directing the necessary capital to grow and commercialise innovations. Very often the technologies behind these periods of speculation have proved to be transformational – leading to significant secondary innovations, new products and services, and far-reaching societal changes to the way that we live, work and consume. Along the way, however, the excitement often turns into an obsessive fervor with investors clambering to get exposure to the theme at any price. That’s when bubbles emerge and, eventually, burst. A recent study found that in a sample of 51 major tech innovations introduced between 1825 and 2000, bubbles in equity prices were evident in 73% of cases1 . From an investor perspective, the success and eventual impact of an innovation cannot be known at the outset, and it is even more challenging predicting which competitor is likely to succeed over the long run. Consequently, as more new entrants emerge, investors tend to buy multiple companies as options on their future success, leading to the sum of all valuations to overstate the potential returns that can be generated by a technology or industry. The challenge for investors is less about whether they recognise an important innovation or market driver when it emerges, but more about whether they value the potential gains correctly and identify the correct winners and losers. This question is relevant in relation to the current focus on AI and its potential. While AI is not a new technology, it has captured the imagination of investors and, by association, companies since the launch of Chat-GPT and other large language models. The extraordinary beat on Nvidia investor day in July 2023 sharpened the focus on the potential for the industry. Since then, investors have clamoured for access to the theme and companies have duly responded with record numbers mentioning AI, even in sectors outside of the industry.

Lessons from History; the Market Risks and Opportunities in AI
What can history tell us about the ‘life cycle’ of new innovations and how they impact the stock market?
Although it is difficult to generalise, some common characteristics are:
A breakthrough technology emerges and reaches commercial scale.
New companies and capital flood into the space.
Speculation builds and valuations of companies rise, often resulting in a bubble.
The bubble bursts, but the technology tends to re-emerge as a principal driver in the economy and stock market.
The technology/industry becomes dominated by a few large players.
Secondary innovations emerge, creating new companies and products that leverage the initial technology and its increased adoption.
Other industries are disrupted by the innovations, forcing incumbents either to adapt or disappear.
The secondary innovations create new employment opportunities and, with them, new sources of demand as many of the benefits are passed on to the consumer. Productivity tends to rise, but usually only after the full adoption of this new technology and network effects are realised.
Throughout this life cycle there are typically both risks and opportunities for investors. The risks include:
Underestimating the impact of competition in driving down returns.
Overstating the returns on capital invested by the innovators that are developing the technology.
The upside opportunities that are often overlooked include:
New companies that can utilise the technology to create new goods and services to drive new sources of demand and growth.
New markets that open up as a result of the technology.
Companies outside of the technology space that can benefit from the technology as demand patterns change.
The impact of competition
When new products or technologies emerge, particularly when they appear transformational, investors tend to underestimate the scale of new competition and its impact on the future returns of the incumbents or originators. There are many useful examples in history that demonstrate the pattern of investor excitement and the promise of high returns leading to a surge of competition and, ultimately, overcapacity that drives down returns. The result is often a large de-rating of companies in the industry and, in some cases, spectacular failures of companies. Nevertheless, this process doesn’t usually mark the end of the technology. Mostly, the infrastructure left behind in the wake of the initial investor surge and capex leads to the emergence of new products and services. These are often underestimated or poorly anticipated.
Here are some of them:
Books, 16th Century
The printing press was one of the greatest ‘enabling’ technologies of all time. Following its invention in 1454, its impact was spectacular. According to research by Buring and Van Zanden2, the number of books published increased from zero to about 3 million per year by 1550 in Europe - more than the total number of manuscripts produced in the entire 14th century. By 1800, 600 million books had been published. As with all technology innovations, the price of books collapsed.
Canals, 18th Century
The innovation of canals for transportation was an important component of the First Industrial Revolution. The first canals built generated strong returns for investors, attracting new inflows of capital that pushed up stock prices and led to a bubble in canal stocks in the 1790s on the London Stock Exchange which peaked in 1793. By the 1800s, the return on capital in canals had fallen from a pre-bubble peak of 50% to just 5%, and a quarter of a century later only 25% of canals were still able to pay a dividend3. Nevertheless, the canal infrastructure became instrumental in reorganising industries and factories, which, in turn, spawned the growth of many new industries, businesses and products. While many of the original companies failed, the infrastructure generated strong growth for others.
Railways, 19th Century
A similar exuberance surrounded the growth of railways in the 19th century in the UK, which were to become equally transformative in terms of economic growth, business organisation and societal change. As capital flooded in, there were nearly 1,240 projects seeking capital by 1845 and the number of miles of network increased from 100 miles in 1830 to 6,123 miles by 18504. A bubble in valuations of railway stocks formed in the 1840s, and by 1850 most stocks had plummeted by an average of 85% from their peak, and the total value of these shares had dropped to less than half the capital spent on them5. As with the canals, the legacy of the infrastructure became pivotal to growth cities, changing demands for consumer products and other industries that followed.
The Telegraph, 19th Century
The innovation of the telegraph in the mid-1840s had a similar effect. By 1851, there were more than 50 different telegraph companies competing in the US, across the same lines. As the returns fell, most of the firms failed or were consolidated into larger units. Ultimately, Western Union Telegraph took over its two major competitors and became the first US nationwide monopoly in 1866.
The Telephone, 20th Century
A similar wave of excitement followed the invention and commercialisation of the telephone. The expiration of Bell’s original patents in 1894 generated a surge of investment and competition. By 1904, 60% of American cities with more than 5,000 people had two phone networks. The competition drove a wave of consolidation led by AT&T, which was eventually restricted by an antitrust settlement in 1913 that prevented it from taking over independent phone companies and forced it to give up its controlling share in Western Union Telegraph Company. Nonetheless, the constraints on its core business encouraged AT&T to invest in new technologies through its Bell Laboratories subsidiary which became a major innovator in new areas of telecom innovation6.
The Radio, 20th Century
The periods after World Wars I and II (WWI and WWII) saw massive demand for consumer products that attracted waves of investment as new market entrants emerged. As broadcast radio took off, for example, demand for radios surged and between 1923 and 1930, 60% of US families purchased a radio. In 1920, US broadcast radio was dominated by KDKA, but, by 1922, 600 radio stations had opened across the US, supported by the growing advertising industry. A bubble developed and the value of shares in the Radio Corporation of America (RCA), for example, rose from $5 to $500 in the 1920s but collapsed by 98% between 1929 and 1932, and most radio manufacturers failed, but the industry continued to grow, supported by advertising and the plethora of new consumer products that emerged.
The personal computer (PC), 20th Century
The PC revolution fueled a similar boom in both the number of companies and the valuations of new entrants in the market. While IBM facilitated the widespread commercialisation of the PC, hundreds of companies entered the market in the 1980s. In 1983, however, several companies in the sector announced losses, including Atari, Texas Instruments and Coleco. A collapse in PC share prices followed and many PC manufacturers went out of business, including Commodore, Columbia Data Systems and Eagle Computer. While several of the surviving businesses took many years to recover, the industry matured and became dominated by just a few companies.
Internet, 21st Century
This pattern was repeated during the internet bubble of the late 1990s. Speculation grew rapidly as investors began to see the potential of the internet. When search engine company Yahoo! had its initial public offering, its stock rose from $13 to $33 in a single day. Qualcomm shares rose in value by over 2,600%, 13 major large-cap stocks increased in value by over 1,000% and another seven large-cap stocks each rose by over 900% in 1999. The Nasdaq index increased fivefold over the period between 1995 and 2000. In just a month after its peak in 2000, the Nasdaq had fallen 34% as hundreds of companies lost 80% or more of their value. The Nasdaq itself fell by nearly 80% by the time it troughed in October 2002.
So, there is a fairly consistent historical pattern: radical new technologies tend to attract significant capital and competition. Not all examples in history end with a spectacular bubble, but most do end with a downward adjustment in prices across the industry as returns moderate. Even in cases where a bubble bursts and many companies eventually collapse, this does not mean that the technology itself fails. However, rising competition is central to reducing returns relative to market expectations at the peak of the cycle. Eventually the market for the original technology tends to consolidate into a few large winners, and the growth opportunity shifts to secondary innovations or products and services that follow the original technology.
With the current dominant companies, the conditions are unusual in that most of these were already dominant in the previous wave of technology — in particular software and cloud. The scale of profitability that they achieved resulted in them being in a unique position to be able to absorb the very high costs of innovation in the AI space. While the protective ‘moats’ around the current AI winners are significant, and valuations are not bubble-like, the number of new patents in this area is growing rapidly, suggesting that new competitors will emerge and costs will come down. The number of patent families (group of patents that are all related to the same invention or technology) in GenAI has grown from just 733 in 2014 to more than 14,000 in 2023.

While the hyper-scalers have huge scale and ability to invest in proprietary AI models, cheaper open source alternatives are emerging at a very rapid rate. The website Hugging Face, which is a network for enthusiasts, already has around 650,000 models8, suggesting that the typical pattern of large-scale capital growth and competition is happening in the AI space, just as occurred in previous waves of technology.
Overstating returns on investment - Telecoms in the 1990s
Just as competition is often underestimated, the returns on capital invested by the innovators are typically overstated. Companies at the epicenter of an innovation often fail to achieve the returns that their high valuations imply as the marginal cost of the technology falls and capacity increases over time, while a typical overlooked opportunity is that investors understate the returns available to new entrants in an industry that emerge after the initial investments are made that can piggyback off the capex of others. In the case of most major technological innovations throughout history, while the potential may be obvious, it is rarely clear in the early stages what business models will ultimately dominate to scale and commercialise the technology. This was evident in the early days of the internet. While there was widespread and broad speculation in any new company that offered potential exposure to the industry, the incumbent winners were generally seen to be the telecom companies. They were viewed as a relatively ‘safe’ route to the potential fortunes that the internet may generate compared to the more speculative unprofitable dot-com companies. Telecoms had the benefit of being well-established companies, in many cases ex monopolies or state-run enterprises, with low volatility earnings and an existing and large-scale client base. They also had tangible assets and owned and developed fibre optic networks, routers, wireless systems and telecoms equipment that were the underlying infrastructure of the internet9. It seemed like they were in a perfect place to receive a high share of the future revenues driven by the internet in e-shopping. But investors significantly overstated the returns on the capital investment that these companies made. This was partly a consequence of new entrants and partly because of the huge scale of capital invested. Competition was stimulated by de-regulation of the industry, led by the US, which introduced the telecoms act of 1996. The act deregulated the broadcast and telecoms industry in order to provide an environment that could take advantage of the technological convergence of these trends and a surge in capital investment followed. According to the Federal Communications Commission, the amount of fibre optic cable laid in the US went from one million miles in 1996 to 10 million by 2000, much financed by debt. When Global Crossing and WorldCom collapsed, they had $25bn and $100bn of debt. A similar pattern occurred across Europe. In the UK, a spending spree occurred after the government allowed 3G spectrum auctions in April 2000 which generated £22.5bn in revenues for the government and similar auctions in Germany raised roughly $30bn. Ultimately, however, the capex boom resulted in severe overcapacity in bandwidth for internet usage. While the fixed costs of these new networks were very high, the marginal costs of sending signals over them was very low1011. Increasingly, competition forced prices down and by 2004 the cost of bandwidth had fallen by more than 90%, despite internet usage doubling every few years. As late as 2005, as much as 85% of broadband capacity in the US was still going unused. Many companies could not repay their significant debts in the US and some of the auctions for 3G licenses in 1999 had to be re-run because the original companies that made the bids defaulted on their bids. When the auction was re-run, the bids were only 10% of the original $4bn raised12. Ultimately, the valuation of these companies collapsed, alongside the broader technology bubble. Between 2000 and 2002, the Dow Jones technology index lost 86% and the wireless communications index dropped 89% with 23 companies going bankrupt in the US alone and the failure of WorldCom became the biggest stock market failure in history with a loss of $102 billion in July 2002. As in other examples in history, the problem was not a miscalculation of the growth potential of the technology, but rather that investors had attributed too much future value to the companies that had built technology and infrastructure to provide it. In this case, like many others before, the ultimate winners were the companies that could ‘free ride’ off this spending and utilise the capacity to build business models that could leverage the technology and provide new products and services. Many of these winners did not emerge until the onset of the smart phone in 2006 and the onset of apps which then spawned a growing industry of platform companies, ride sharing, social media and so on.
History lessons; the opportunity
While the market for a technology innovation can become dominated by a few very large companies for a long time, the initial transformative technology becomes a conduit that kickstarts a whole range of other innovations and, with this, new companies and market opportunities. At the same time, one of the other characteristics of technology is that once new innovations become widely used by companies, the main beneficiary is the consumer who enjoys new products and services at lower prices. For example, while coal and steam were the foundations of the First Industrial Revolution, a range of other developments quickly followed. Mass migration to cities and the movement away from agriculture resulted in demand for new consumer products. Mechanised looms transformed the textile industry and domestic products such as soaps, which were typically made at home, began to be manufactured in factories. This generated new markets and became the catalyst for the building of consumer brands, advertising and marketing. During the railway boom, the steam engine spawned the development of the railways, and the network effect and connectivity then allowed other technologies to develop. Similarly, during the Second Industrial Revolution, the harnessing of gas and oil to create electricity was one of the key driving inventions. But this, in turn, enabled the mass production of steel, the development of the internal combustion engine and the automobile. The start of the modern assembly line in factories became a further innovation, transforming the production and distribution of a range of new products. Similarly, the network impact of the railway boom and the telegraph fostered a host of new market opportunities and companies. With the computer age of the Third Industrial Revolution came the rapid acceleration of service industries. The first transistorised consumer products started to appear in 1952, opening new markets as consumers were willing and able to pay a premium for low power consumption and portability. By the mid-1950s, prototype silicon devices were developed in Northern California. Plastics and lighter materials also generated significant new growth markets, while the growth of multinational companies opened new market opportunities. A similar pattern emerged with the internet as its rapid roll-out and adoption enabled the development and penetration of the smartphone. This, in turn, spawned an industry of companies based on the ‘apps’ used on these phones (think of the revolution in taxi and food delivery services, for example) and the ‘internet of things’ (a world of connected appliances and devices). So, while the leading tech today will most likely remain dominant in their respective markets, rapid innovation, particularly around machine learning and AI, will likely create a new wave of tech superstars. It is probable that AI and robotics will not only create new faster-growing innovative companies but also raise the prospect of major restructuring gains in non-technology sectors.
AI Is Still Not in a Bubble... but Diversification Is Important
Despite the significant interest that AI has generated, it still does not appear to have driven a bubble in valuations which sets it apart, so far at least, from previous narrative investment cycles like the internet in the late 1990s. The dominant companies are less likely to be in a bubble if we compare their valuations to other periods. Current valuations are much lower than have been typical in other recent bubble periods, stretching back to the Nifty 50 era of the early 1970s, the Japanese bubble in the late 1980s and indeed the technology bubble in 2000 (Exhibit 5). For example, the median PE and EC/Sales of the 7 biggest technology companies today is roughly half that of the dominant 7 at the peak of the technology bubble in 2000.

Perhaps more importantly, however, the current dominant companies are much more profitable and have stronger balance sheets than those that dominated during the tech bubble (Exhibit 6).

Over-investment risks
While the dominant companies may have justifiable valuations based on their current and expected cash flows, there remains a risk that they will not achieve the returns on their investment that the market currently assumes. From the late 1990s, software and, later, cloud computing were able to be highly effective in leveraging the technologies with very high margins and low capex. The era of ultra-low interest rates following the financial crisis rewarded these business models relative to traditional industry that had very high capital invested but achieved low returns (see Exhibit 7). Most of the AI ‘hyper-scalers’ emerged out of these successes and have the scale and cash flows to invest. Nevertheless, the AI winners of today are no longer capital-light businesses. Just as we saw with the networking companies of the internet, AI is driving a major capex boom and threatens to stifle the high rates of returns that have characterised the sector over the past 15 years and which current valuations imply will continue.

Many leading tech companies are now ramping up their spending at an extraordinary rate. According to Alphabet, spending on capex was $12bn in Q1 2024, driven ‘overwhelmingly by investment in our technical infrastructure, with the largest component for servers, followed by data centers’. For the year it expects a similar run rate, so close to $50bn. A new forecast from the International Data Corporation (IDC) Worldwide Artificial Intelligence Spending Guide shows that global spending on AI, including software, hardware and services for AI-centric systems, is expected to grow at a compound annual growth rate (CAGR) of 27% over the 2022-2026 forecast with spending on AI-centric systems expected to surpass $300 billion in 2026. Nvidia has predicted that $1 trillion will be invested by 2027 in data center upgrading alone. The hyper-scalers alone now represent 23% of total S&P 500 capex and R&D.

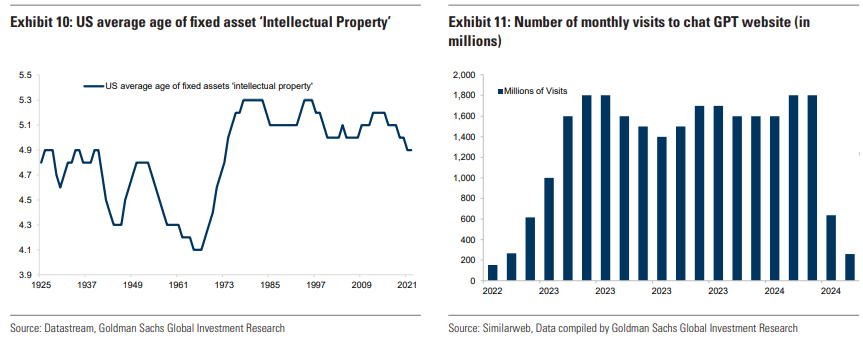
Investors have become increasingly confident about the future revenues in both semiconductors and hardware ‘enablers’. Perhaps surprisingly, despite all the capital invested in technology, there is little evidence that the age of the intellectual property assets are rising. Indeed, since the start of this century, estimates suggest the age is declining (Exhibit 10). Furthermore, the original ‘excitement’ about chat-GPT is fading in terms of monthly users (Exhibit 11). This does not mean, of course, that the growth rates in the industry will not be strong, but it does suggest that the next wave of beneficiaries may come from the new products and services that can be created on the back of these foundation models.
The risk is that as competition increases, the returns and margins begin to fade, and the growth rates of many of the current dominant companies will likely adjust lower. Nevertheless, there are some reasons to be more hopeful that in previous technology cycles. Importantly, while capex is rising sharply, our US strategy team notes that capex relative to revenues is less alarming. At the height of the Tech Bubble, TMT stocks were spending more than 100% of cash flows from operations (CFO) on capex and R&D. Today, the capex and R&D as a share of CFO equals 72% currently in the US, compared with a 40-year median of 67%. Furthermore, as our technology analysts have argued, the significant step-up in capex may actually generate strong returns and, by comparison, may not be very different from what we saw with the cloud innovations. They reflect on the 2013-2016 time frame when Microsoft was spending aggressively on capex to build out Azure when, at one point, gross margins for Azure were negative but then became hugely profitable. They argue that Microsoft Gen-AI revenues ($5-6 billion annualised) have scaled more rapidly compared to Azure, which took roughly 7 years to get to comparable levels. Though capex intensity is up sharply overall for the leading AI tech companies, today it is still roughly where we were in the Azure cycle at comparable revenues. Additionally, while capex has increased, and expectations of future revenues have accelerated, the period of ‘payback’ on cash flows embedded in current valuations remains much lower than it was at the peak of the technology bubble in 2000 (Exhibit 12).

AI and the Risk of Concentration
While these companies may be less highly valued than in other narrative-led bubble periods, the scale of market dominance is greater this time. The 10 biggest stocks have their highest share of the market for many decades at over one third of the index, while the five biggest companies are worth 27% of the total value of the S&P 500 (Exhibit 13).

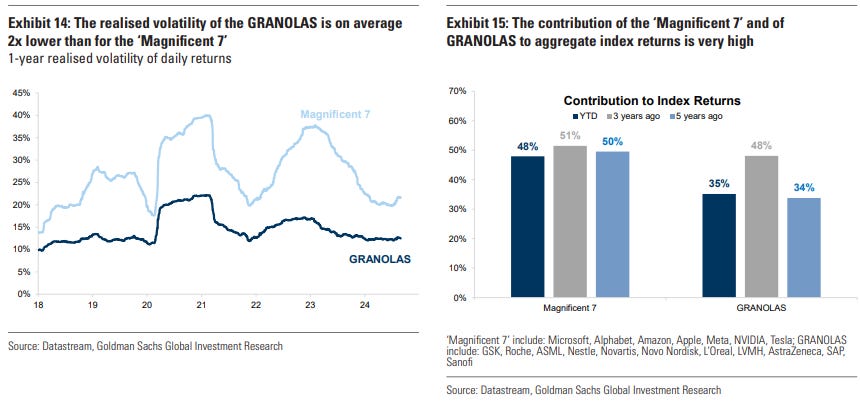
This, again, may not be irrational. The power of the dominant companies to generate shareholder returns and compound over time is a feature that has been recognised in much of the literature on the subject. Bessembinder14, for example, conducted a study of all 26,168 companies in the US that had publicly listed equity since 1929 and found that, over time, while aggregate wealth creation had been $47.4 trillion, the majority reduced shareholder wealth. He also found that the extent to which stock market wealth creation is concentrated in a few companies has increased over time. One of the reasons for this may be the growing issue of scale required in dominant technology platforms, particularly when it comes to compute power and R&D spending. Furthermore, the scale of the investments required to ramp up in this industry preclude some smaller competitors, particularly now that interest rates have increased and the cost of capital is higher. Nevertheless, with markets being increasingly dependent on the fortunes of so few, the collateral damage of stock-specific mistakes is likely to be particularly high. Furthermore, other leading companies in other sectors, or parts of the World, enjoy lower volatility than these companies. This is true, for example, for the GRANOLAS (a list of 11 dominant companies in Europe). Prior to the market correction in July, the ‘Magnificent 7’ stocks had explained around 50% of the S&P 500’s returns (Exhibit 15).
Is high stock concentration a big risk?
Historically, with new entrants emerging, few companies remain unscathed as competition either forces companies to disappear, merge or be acquired. From this perspective, a market that becomes dominated by a few stocks becomes increasingly vulnerable to either disruption or anti-trust regulation. Even companies that have enjoyed near monopoly power in the past have ultimately succumbed to these pressures.
Standard Oil, for example, controlled over 90% of oil production in the US by 1900 and 85% of sales.
Bell Telecom had reached 90% of US households by 1969. Just before it relinquished control of the Bell Operating Companies and was split into different companies in 1982, it reached 5.5% of the market.
General Motors’ earnings were more than 10% of the S&P 500 between 1955 and 1973. At its peak, General Motors had a 50% market share in the US and was the world’s largest automaker from 1931 through to 2007.
IBM became dominant in mainframe computers in the 1970s and had over a 60% market share in mainframe computers in 1981.
Microsoft became dominant in PCs, and by 2000 had a 97% share in operating systems in the PC and laptop markets.
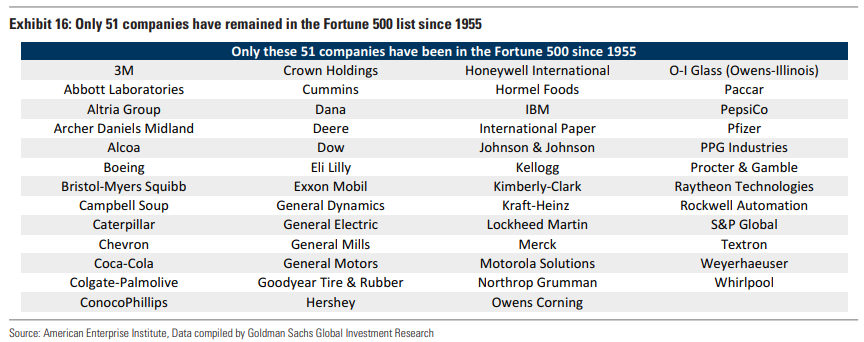
There are, for example, only 51 companies that have appeared every year in the Fortune 500 since 1955. In other words, just over 10% of the Fortune 500 companies in 1955 have remained on the list during the 69 years through this year15. Based on this history, it would appear reasonable to assume that when the Fortune 500 list is released 70 years from now in the 2090s, almost all of today’s top companies will no longer exist as currently configured and will be replaced by new companies in new, emerging industries that we can’t even imagine today.
This process sometimes accelerates or slows down but since 1980, for example, more than 35% of S&P 500 constituents have turned over during the average 10-year period, largely reflecting innovation. Of the current top 50 companies in the US, only half were in the top 50 a decade ago, and many did not even exist before the 1990s (NVIDIA (1993), Amazon (1994), Netflix (1997), PayPal (1998), Alphabet (1998), Salesforce (1999), Tesla (2003) and Facebook (2004). More recently Nvidia has grown at an extraordinary pace, becoming the world’s biggest company from a relatively small base just a few years ago. As a result of changes in leadership and, by implication, growth, history would suggest that buying dominant companies generates lower returns over time. For example, Exhibit 17 shows the total return on average since 1980 that would have been achieved by buying and holding the top 10 stocks over different time horizons (from 1 year out to 10 years), while Exhibit 18 shows the same in relative returns (compared with the S&P 500). These data suggest that, while absolute returns remain good for the dominant companies, these strong returns fade over time, and they often remain solid ‘compounders’. Importantly, however, the returns are generally negative for dominant companies if an investor buys and holds them as other faster-growing companies come along and outperform.

None of this means that these companies would necessarily be poor investments. They may well remain good compounders, be more defensive and enjoy lower volatility and higher risk-adjusted returns. However, it does suggest that:
1) The dominant companies are unlikely to be the fastest-growing companies over the next decade.
2) The stock-specific risk in the index is currently very high, suggesting an increasing pay-off through diversification.

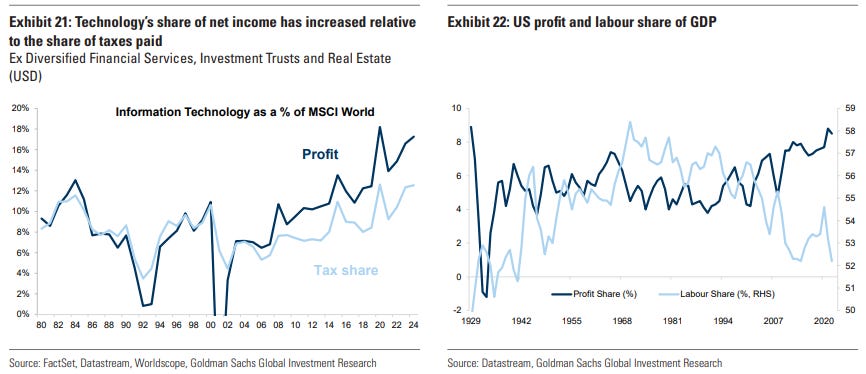
The risk of anti-trust regulation In addition to the risk of competition and failure to adapt, regulatory pressures pose a risk for very dominant companies with increasingly monopolistic power (see: US Economics Analyst: Concentration, Competition, and the Antitrust Policy Outlook, 18 July 2021) and the recent collapse in many Technology companies’ performance in China illustrates this. The tech sector and internet platforms have become a major political focus in both the US and China – the markets with the highest concentration of large-cap Technology stocks. The most recent news on the DOJ subpoena of Nvidia in its antitrust probe, and the share price reaction, is an example of the impact that such news can have on highly rated growth companies. Social attitudes towards tech companies may also be changing as they are seen increasingly as gaining huge profits while employing relatively few people. The continued rise in the profit share of GDP relative to the labour share of GDP leads (Exhibit 22) into the narrative that many of the most profitable companies need reigning in, or taxing more. Many of these companies that were historically difficult to tax are becoming easier targets as they build up large data centers and physical capital. As Exhibit 21 shows, their profits have increased by much more than their tax rates in recent years. Governments will be keen to find new sources of tax revenue and the increasingly high energy demands of the major technology leaders might be seen as a justification for higher taxes. According to the International Energy Agency, data centers already account for about 1% to 1.5% of global electricity use16.
Our US strategists’ analysis of company stock performance following previous antitrust lawsuits by the DoJ and FTC shows that revenue growth slowed, valuation compressed and shares underperformed the overall index (Exhibit 23, Exhibit 24). However, the cases took years to resolve and share price response was often muted during the initial stages. The most prominent examples include AT&T, where a break-up was mandated by a consent decree following eight years of litigation (1974-82); MSFT, where a settlement was reached involving a consent decree and changed business practices following three years of litigation (1998-2000/01); and IBM, where no formal action was taken after 13 years of litigation (1969-82) — see: US Equity Views: Equities, antitrust, and the “inestimable” value of due process, 13 July 2021.

Nevertheless, we see three reasons why dominant tech companies may stay bigger for longer in the current cycle than we might have seen in historical technology cycles:
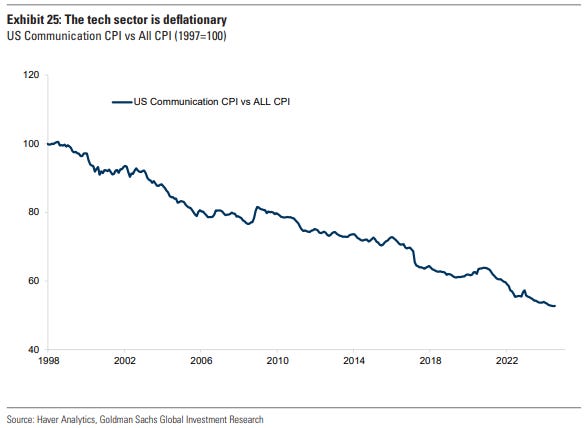
1) The tech sector is deflationary (Exhibit 25). As long as that is the case, there is no real incentive for politicians to attack it. In this way, the tech sector from a policy perspective may be different from others, such as banks, supermarkets or energy companies, where politicians often argue that the benefits (for example of higher interest rates for savers, or lower food and energy prices) are not being passed on to consumers. This does not make technology companies immune from regulation, but it is more likely to come from issues around privacy and use of data, or the impact on mental health, than on pricing.
2) Technology is increasingly seen as an issue of national security. Technology, including cyber security, chips and increasingly AI, are seen as a critical part of national infrastructure and strategic defense. This has become more important as geopolitical tensions rise across the world, making it less likely that a government would support anti-trust legislation that undermines a competitive lead. For example, the US in its Foreign Direct Product Rule (FDPR) allows US officials to control the flow of foreign products built with US-originated technology. IBM recently has announced the closure of its China R&D operation with the loss of 1,000 jobs, and there are recent news reports that ASML will put more curbs on its China business.
3) The technology sector invests hugely in R&D. Given that the current incumbent winners are so cash-generative, they have an ability to maintain this investment, strengthening their market ‘moat’ and also potential future growth. According to Erik Brynjolfsson, Professor and Senior Fellow at the Stanford Institute for Human-Centered AI, the top 10% of firms by market value account for over 60% of this intangible digital investment (see Top of Mind: The post-pandemic future of work, 29 July 2021). “They’re pulling further away from firms at the median and bottom, so that inequality is growing over time. That’s leading to a ‘winner-take-most’ outcome in which superstar firms are harvesting most of the gains from new technologies rather than those insights diffusing evenly throughout the economy. And that’s also happening at the level of individuals and workers — the labour share of income has fallen in recent decades, and the top 1% is getting ever wealthier as they capture a growing share of total income”. Our analysts also see significant opportunities for secondary growth opportunities in cloud computing coming from AI. They estimate that the Cloud Software TAM (IaaS, PaaS, and SaaS) could approach $2 trillion by 2030 (CAGR: 22%, 2024-2030). Their analysis suggests Gen-AI spending could constitute 10–15% of the Cloud Software market ($200-$300bn) as spending gradually extends beyond the hyper-scalers and foundation model providers to become more pervasive across all three layers of the tech stack (see: Gen-AI Part VIII: Catalyst or Culprit?, 25 Aug 2024).
Opportunities for Diversification
Ex Tech Compounders (ETCs)
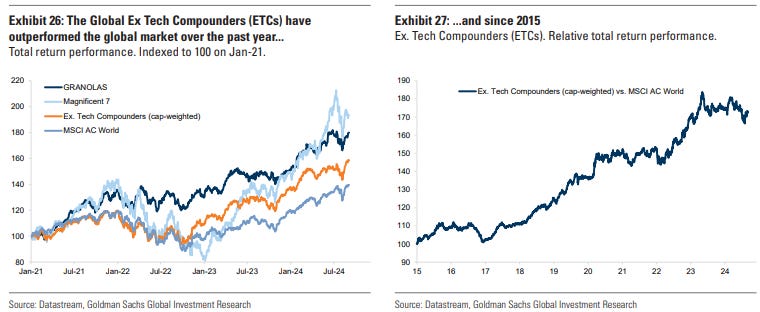
While technology may not be in a bubble, the characteristics of large cap technology can be found in a more diverse and diversified portfolio. It is true that few companies match the earnings growth that the largest tech companies have been enjoying; however, there are plenty of companies that do have high margins and returns on investment, reinvest for future growth and have strong balance sheets that exist outside of the tech sector. We call these the Ex Tech Compounders, or ETCs. We have put together a list of global ETCs, which can be found in the Appendix. The list looks for companies that have market caps above $10bn and have high margins (EBITDA > 14%, EBIT > 12%, Net Income > 10%), high profitability (ROE > 10%), strong balance sheets (ND/Equity < 75%, ND/EBITDA < 2x), low volatility (Vol < 50), strong growth prospects (sales > 4% and earnings > 8%) and have consistently grown their earnings over the past decade. As Exhibit 26 shows, the ETCs have outperformed the global market over the past year and have kept pace with the performance of the ‘Magnificent 7’. The valuation of our global ETCs list is in line with its average since 2016 and the list trades at the lowest premium to the world stock market since 2018.
Healthcare and Biotech
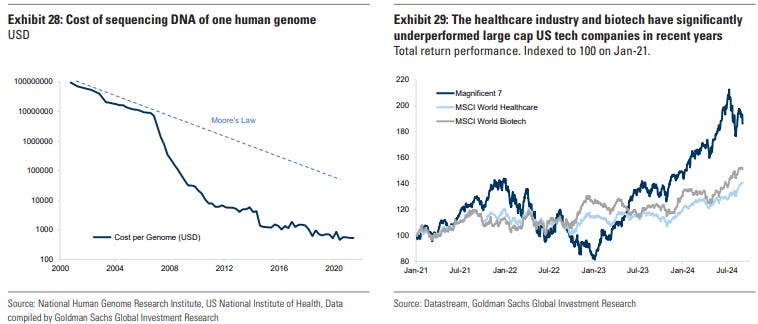
One area likely to benefit from AI and the ability to analyse large data sets is healthcare and bio technology. We have already seen very dramatic reductions in the costs of DNA sequencing (Exhibit 28) with the cost of sequencing an entire gnome falling from $100 million in 2001 to $50 in 202217. The pace of this reduction far outpaces Moore’s law and suggests a significant increase in the productivity and cost of developing new medicines and therapeutic discoveries (). AI has also been instrumental in speeding up data processing in the development of vaccines. For example, linearFold, an algorithm for ribonucleic acid (RAN) secondary structure recognition, increased the speed times for Covid-19 sequencing from 55 minutes to 27 seconds18. The healthcare industry and biotech have significantly underperformed large cap US tech companies in recent years, suggesting that the opportunities are not fully reflected in valuations (Exhibit 29). Our healthcare analysts believe that AI can accelerate synthetic data generation for drug development and diagnostics, generating designs for novel drugs, personalised medicine, diversity and equity in healthcare, manufacturing and supply chain efficiency, and approval and launch materials.
Banks and Financial
Services Our analysts see: 1) Enhanced coding efficiency, 2) Data extraction: Synthesise data and content from large datasets or documents, 3) Chatbots, 4) Automation, 5) Human/AI collaboration. In Europe, for example, our banks team estimate the potential AI adoption uplift to ROE at c.200bp (excluding the upfront investment required). They highlight the AI impact is most clearly driven by numerous modest cost gains, with the cost opportunity c.3x the revenue opportunity.
Consumer Products and Services
Academic work points to only a small proportion of the social returns from technological advances over the 1948-2001 period being captured by producers, indicating that most of the benefits of technological change are passed on to consumers rather than captured by producers. These results indicate that the bubble of new-economy stocks in the 1990s resulted from the alchemist fallacy19. This was evident in the case of the internet. Waves of new products and services emerged in the years after the bubble burst with the emergence of the smart phone and apps. Arguably, many of these products did not answer an urgent problem that needed to be solved but rather developed new products that then created demand – ride-sharing, platform business, social media and so on. It is likely that a similar pattern will develop with AI.
Robotics and Cyber Security
According to Cybercrime Magazine, cybercrime would have a value equivalent to the third-largest economy globally, at $10.5 trillion annually by 2025, while Statistica suggests it will rise to $13.8 trillion by 2028. The demand for cyber security will rise dramatically and AI can help in this process. Current processes cannot keep up with the volume of malware, estimated at around 1 billion programmes with 560,000 new pieces each day according to DataProt20. AI automation can help to detect and differentiate between those that are most harmful21. Our analysts expect Security vendors to emerge as beneficiaries across both the infrastructure and application layers as well as within data posture investments as security continues to trend higher as a percentage of total budgets. In robotics, a whole range of other applications driven by emerging companies might become large markets —autonomous driving, for example, or humonoid robotics, enhanced by AI. Already advances are evolving rapidly and according to industry estimates the global market for humanoid robots could reach £214bn by 203222. Of course, it is not possible to anticipate what these products may be or who is likely to develop them, but that is another reason for ensuring broad diversification in equity exposure as well as balanced portfolios have access to private markets where many of the nascent companies may be.
Ethics and nostalgia markets
In past technology cycles, the second-round impacts on work and society often drive new areas of consumer growth. It is likely, for example, that more AI will mean more demand for fact-checking services. The ability to work more productively from home may mean the regentrification of shopping and entertainment in neighbourhoods close to large-density populations. The growth of artificial immersive entertainment may also boost demand for experiences in the real world. This might reflect the growing popularity of goods and services that are seen as ‘authentic’ or nostalgic. Retro ‘crafts’ are growing in popularity, whether it be the growth reality TV programmes where contestants compete in baking, spelling, sowing or even ballroom dancing competitions. These fashions are spreading into retail. According to Grand View Research, for example, the market for so-called ‘artisanal’ bakery products was valued globally at $95.13 billion in 2022 and is likely to grow at a compound rate of 5.7% from 2023 to 203023. The focus on sustainability and interest in the past together create new consumer markets. According to research conducted by GlobalData for ThredUP, a US second-hand store, the resale clothes market is growing at 15 times the rate of traditional retail24. According to a report by Statistica, as of 2021, 42% of millennials and Gen Z respondents stated that they were likely to shop for second-hand items25. A similar trend has emerged in transport with the growth in the ‘sharing’ economy and the growth of cycle, scooter and car sharing. Few would have predicted the steady growth in the bicycle market a decade ago; the global bicycle market was valued at over $64 billion in 2022 and is expected to grow at a compound rate of 9.7% from 2023 to 203026. Perhaps even more striking is how the bicycle is outselling the car. Analysis of 30 European countries by the Confederation of the European Bicycle Industry (CONEBI) and the European Cyclists Federation (ECF) suggests that, at the current trajectory, 10 million more bikes will be sold per year in Europe by 2030, representing a rise of 47% compared with 2019. On this basis, the 30 million bikes sold annually in Europe would be more than double the annual sales of cars27. Ethically produced products and services is also a growing market and AI can help. Research from Bain found that 7% of consumers in rich developed countries are willing to pay a premium for sustainably sourced products and brands28. AI can help develop a supply chain inventory, making it easier for companies to prove provenance and quality of their components and ingredients. In the 21st century, in a highly digitalised world where almost everyone is connected to the internet and the cutting edge of technology threatens to displace jobs and companies, it is meaningful that one of the biggest company in Europe is LVMH. This is a company that sells the value of heritage in historic brands. It was formed in 1987 through the merger of two old companies: Louis Vuitton (founded in 1854) and Moet Hennessey, which itself was a merger in 1971 between Moet & Chandon, the champagne producer (founded in 1743) and Hennessey, producer of cognac (founded in 1765). According to its website, the company develops the brands that ‘perfectly encapsulate all that they have embodied for our customers for centuries’.
As the ubiquity of technology increases and individuals increase their reliance on technology as they communicate via networks, the value they place on ‘authenticity’ and human connectivity – which can evoke a nostalgic image of a simpler, pre-digital life – is likely to grow. This is true across many product categories, including food.
The old economy and infrastructure
Increasingly, the ambitions of large cap tech companies are dependent on greater electricity generation and infrastructure. Many of the companies that stand to benefit from this trend are in the ‘old economy’ and have much lower valuations, having stagnated and disappointed for many years. AI could continue to boost returns in the Technology space, but for these companies to fulfill their potential, they will need huge increases in electrical power (and, with it demand for infrastructure spend and copper). Our analysts estimate that data center power demand is poised to grow 160% by the end of the decade, which should drive a significant acceleration to a level of electricity growth in the US and Europe not seen in a generation (see GS Sustain: AI/data centers’ global power surge and the Sustainability impact, 28 April 2024). After stagnating over the last decade, our US utilities analysts expect US electricity demand to rise at a 2.4% compound annual growth rate (CAGR) over 2022-2030, with data centers accounting for roughly 90bp of that growth, and data centers will likely more than double their electricity use by 2030. This implies that the share of total US power demand accounted for by data centers will increase from around 3% currently to 8% by 2030, translating into a 15% CAGR in data center power demand from 2023-2030. A similar trend is in play in Europe and Asia. Our European utilities analysts also expect a secular capex supercycle ahead with European investments in power grids accelerating by 80-100%, depending on the region. And on the renewables front, they expect Europe to add nearly 800 gigawatts (GW) of wind and solar over the coming 10-15 years, nearly tripling the amount currently installed in the region (see: Gen AI: Too much to spend, too little benefit?, 25 June 2024).
Decarbonisation and an energy transition is what is needed to generate this power. But to do this, a capex super cycle is needed that will benefit many of the left-behind value sectors.