Exclusive - End of interest rate cycles (01/18/2024)
**This was originally written on January 18th, 2024**
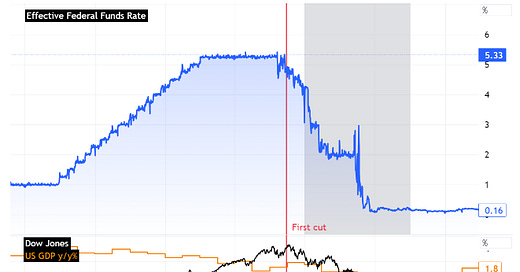
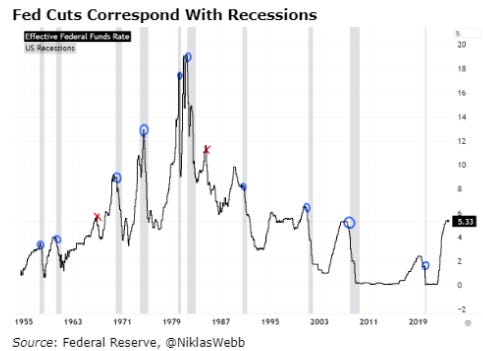
The end of interest rate cycles are controversial and heavily debated on the appropriate actions required to ease monetary policy while still achieving the Fed’s goals without over or under extending. While quantitative tightening is almost always a cause for weaker economic data in the near future as the goal is clearly to slow economic growth, the ‘recession’ historically doesn’t come until the mid to end of the Fed cycle. Whether this can be explained by Modern Monetary Theory based on the assumption of what the economy can handle rather the projections of the Fed, or other factors, the end of interest rate cycles always determine the success of a ‘soft landing’.
While the goal of this research isn’t to critique the Fed, I will review the Feds’ actions and use historical data from previous cycles and compare it to the current environment to make forecasts on the economic and market implications of ending this interest rate cycle.
My analysis will be broken down into three parts: Impact on consumers, corporate health, and markets.
Introduction
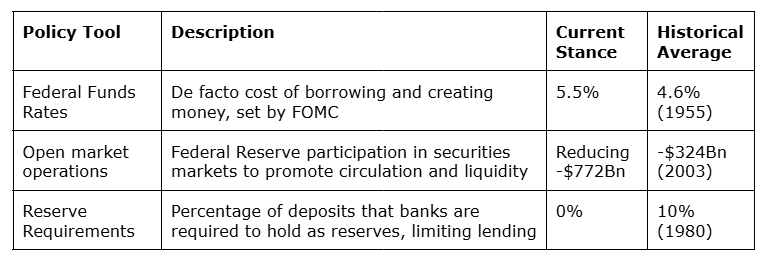
Modern Monetary Theory is an economic framework that challenges conventional views on monetary policy among other things, but I will focus on just the most used tools in US central banking. As a reminder, the FOMC has three primary policy tools it uses:
Contrary to what most believe, MMT recommends the idea of making economic policy based on the current health of the economy rather than the Fed’s goal. While this isn’t entirely true in practice, it has been incorporated into the FOMC’s decisions since at least the late ‘90s and early 2000’s. This is the basis for the theory that recessions usually occur during the easing phase of quantitative monetary policy rather than what seems obvious, during tightening. And this actually has some truth to it as I will further analyze. The most notable example of this was during the 2008 Financial Crisis when rates were cut in advance to when most would consider the recession to have started.
So, if that’s the case, how likely is it that will happen this time? What other factors, if any, can confirm a recession this cycle? What are the implications of this on the economy and markets?
To start, we must first view the economy through the same lens as the Fed. It doesn’t help that the Fed has historically been very secretive about their forecasts until recently and only ominously hint at what indicators they’re watching to determine appropriate action. However, two things we know they’re focused on most as made apparent by their mission statement is 1) inflation and 2) unemployment.
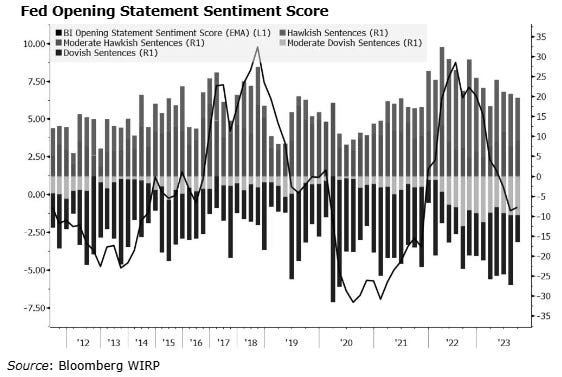
Starting with inflation, it might seem rather obvious that the Fed watches inflation, but there are many complex components outside of headline inflation that the average economist watches; core, consumption, expenditures, producer costs, supply chain pressure, and other variables such as demand. The more important question is finding which one the Fed places the most emphasis on. It is also important to consider the different members of the board as even the longest serving current FOMC governor only took office in 2015. Bloomberg’s Fed Spectrometer has a number of interesting tools to analyze FOMC sentiment.
The current Fed is in the upper percentile of hawkish boards throughout FOMC history. However, without enough information on every Fed member's individual forecasts and stance, I will treat the current Fed as the same as any historically for simplicity purposes.
Gauging the Feds Focus
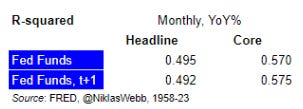
The Fed's primary indicator can be narrowed down to a few options based on speeches. Using data from 1958 to current, we can get a sense of what was most influential in policy making.
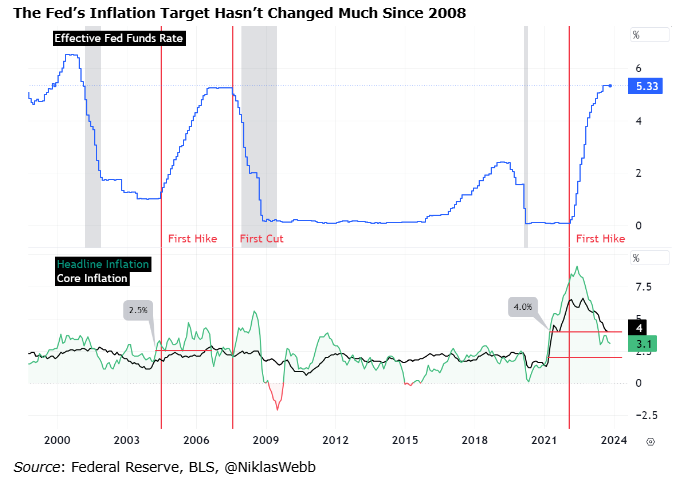
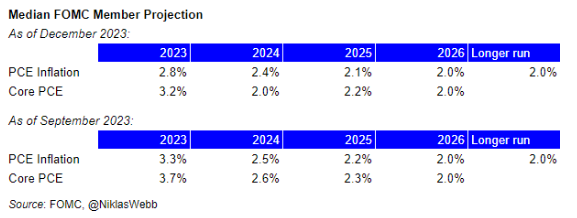
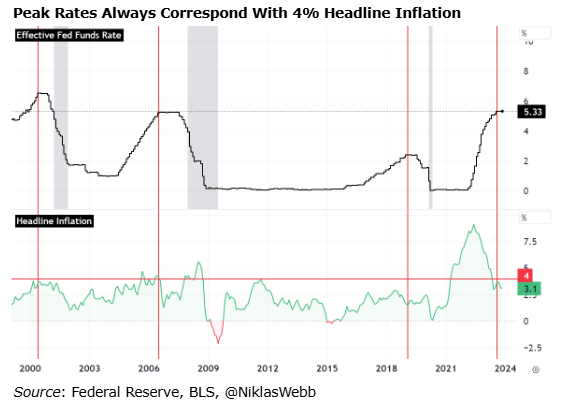
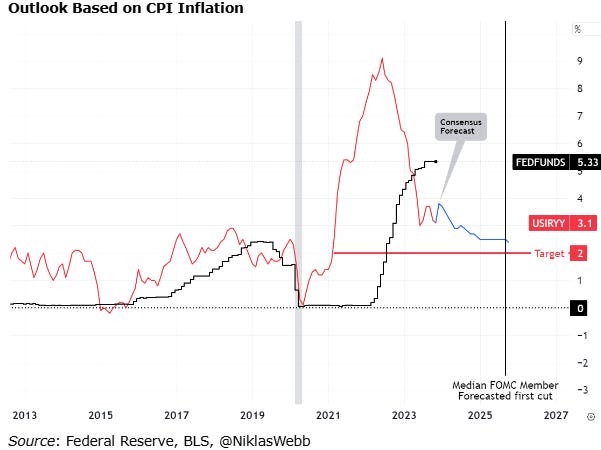
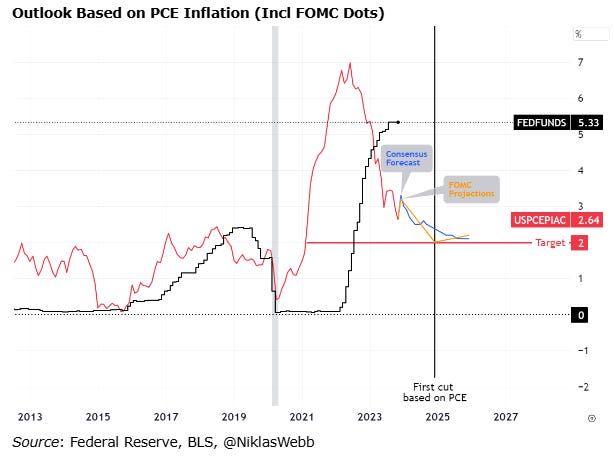
My data shows the Fed has a slight preference for core inflation over headline. Unfortunately, the Fed doesn’t include CPI forecasts in their SEP (only for PCE, more below). However, the headline inflation target, which we know is roughly 2% this cycle, was approximately 2.5% in the 2008 cycle. It’s also notable that, in recent history, terminal rates were reached when headline inflation crossed under 4%.
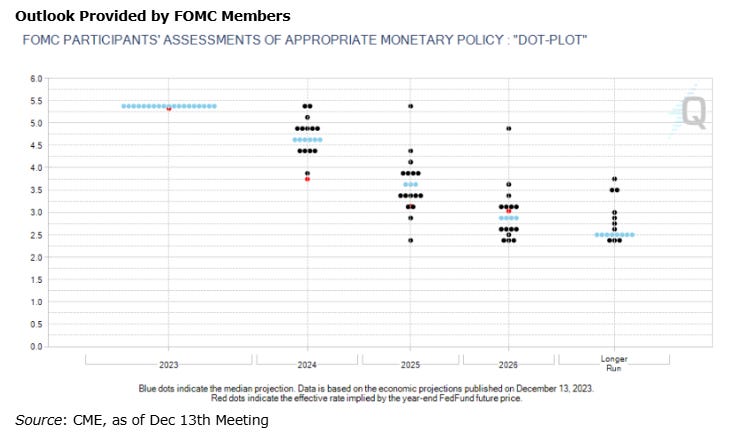
Exactly how strict the Fed is with their target is also unknown, but based on Powell’s commitment and past cycles, it’s unlikely we’ll see any cuts until PCE inflation is below a hard 2% target. Nonetheless, the FOMC ‘dots’ show the median member projects 3 rate cuts in 2024.
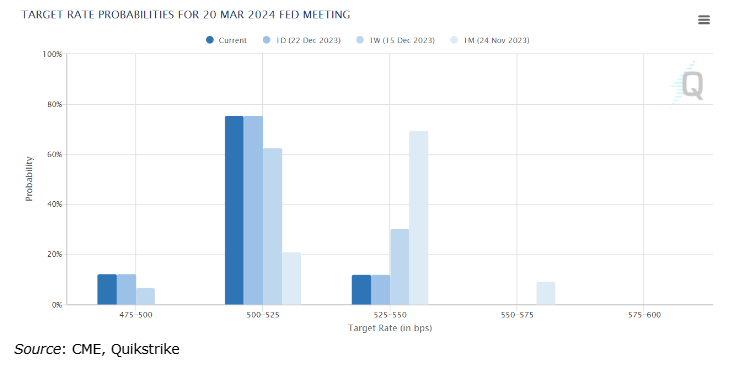
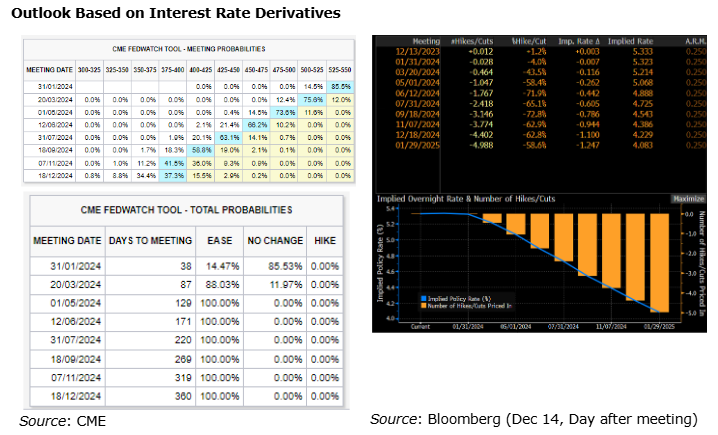
One other consideration for forecasting rates is looking at the rates market. Interest rate derivatives on Fed Funds moved meaningfully after the December 2023 FOMC meeting, particularly on Mar’24 contracts. The March meeting outcome probability based on implied rates changed from 69.5% chance of no change to 75.6% chance of a 25 bps cut.
In conclusion, I’ve provided four scenarios for Fed cuts.
Fed Funds Outlook
Consumer Health
Employment
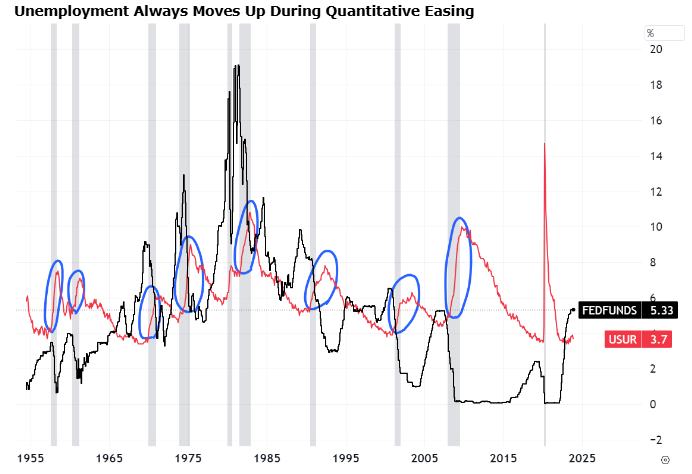
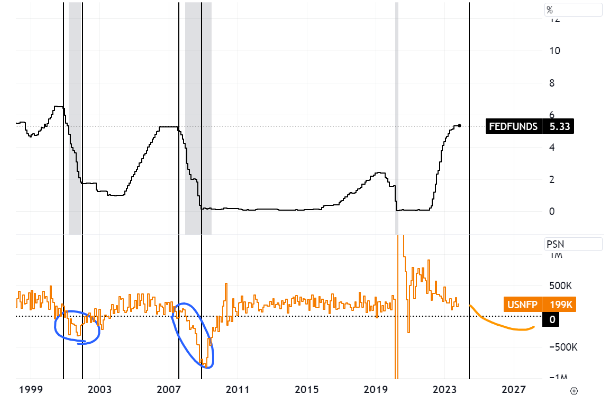
We know that rising interest rates have always had an impact on labor markets. The most obvious impact is on the unemployment rate. However, the same lag effect explained by MMT applies here. Unemployment’s biggest spike tends to occur in the latter half of interest rate cycles as demonstrated here:
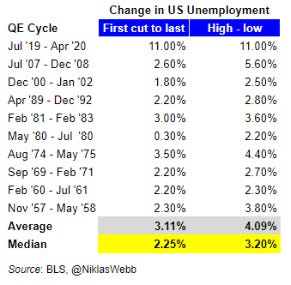
My data shows that every QE cycle since 1954 has been associated with some spike in unemployment
The average change from first cut to last cut was 2.25%, while the difference between the highest and lowest in the twelve months before and after the start and end of the QE was 3.2%
No other headline economic indicator can be associated with such large increases in unemployment in the last 70 years besides the Covid 19 pandemic.
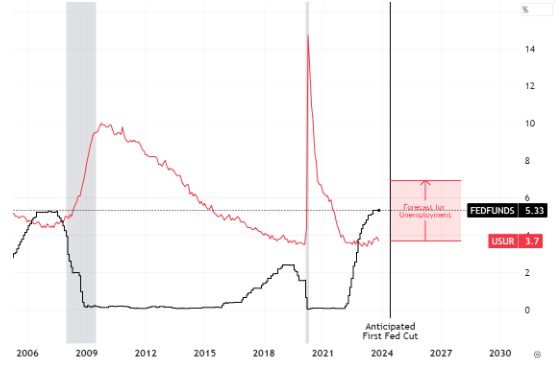
Based on this, I expect US unemployment to peak around 7% in the next recession, a decade high (ex-Covid) but not as bad as 2008:
A 3.2% rise in unemployment is consistent with -5.4 million jobs, or about -225k NFP per month:
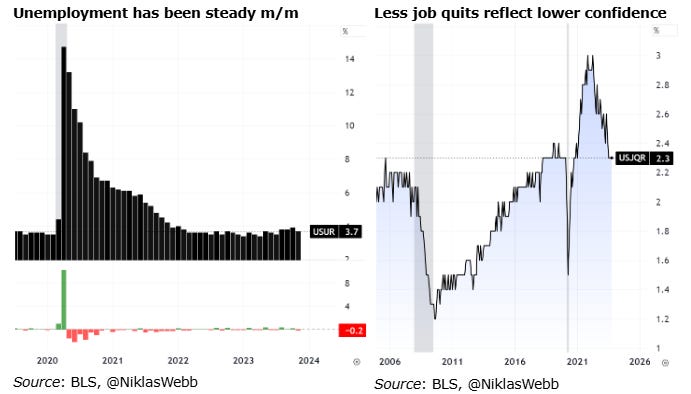
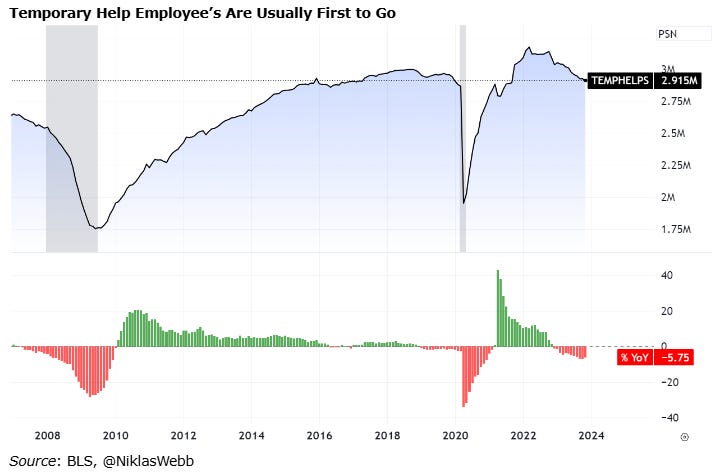
How employment statistics actually look right now:
Wages
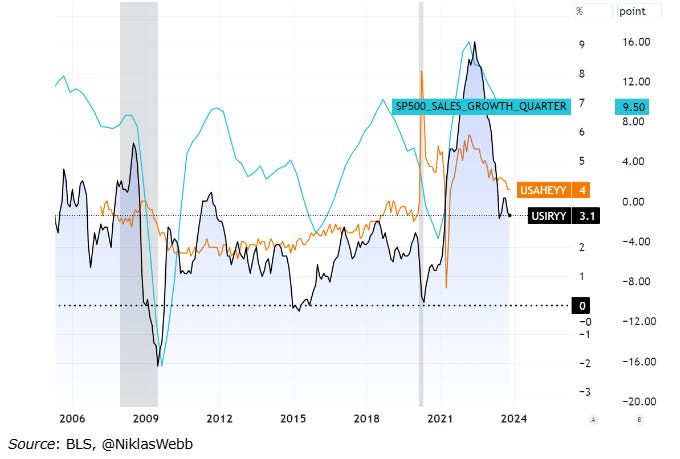
The unfortunate news is, as inflation cools, wages are expected to too. This is explained by corporate sales as revenue heavily depends on inflation. This, inturn, pushes average hourly earnings lower:
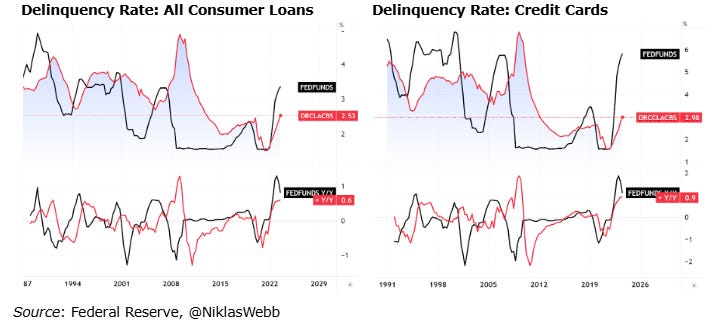
Consumer Credit
Higher Fed Funds Relay Higher Delinquency Rates on Consumer Loans
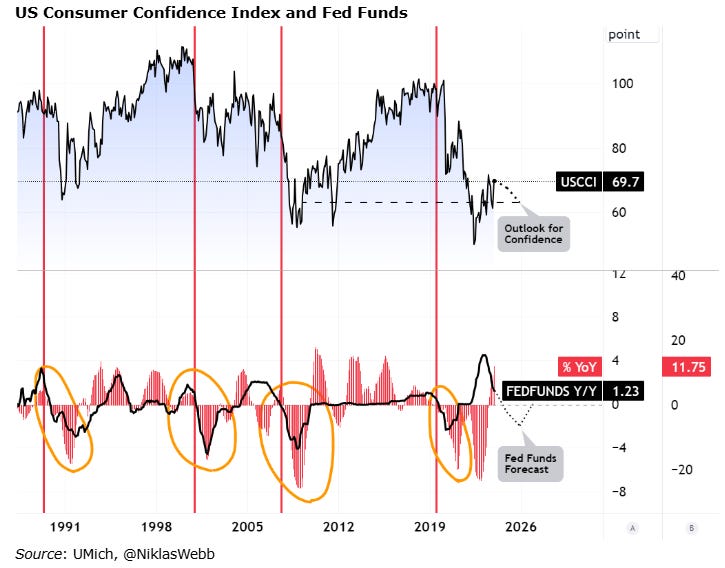
Consumer Confidence
Ultimately, consumer confidence reflects the overall well being of consumers. The UMich CCI Survey shows a strong relationship between confidence and interest rates especially during Fed cuts. Based on the provided Fed Funds outlook from the FOMC, consumer confidence would decline about 700bps by E2025, the lowest normalized reading since 2020 and 2008.
Corporate Health
Economic Activity
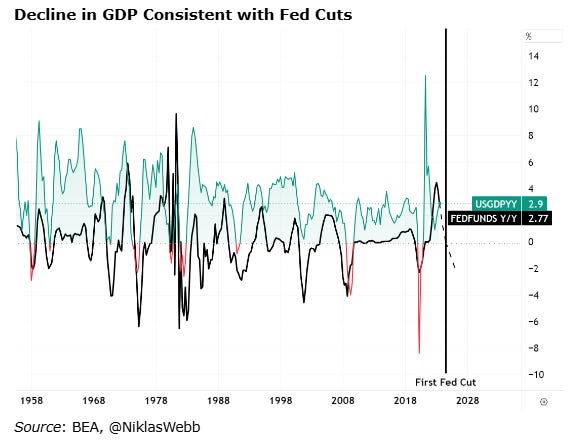
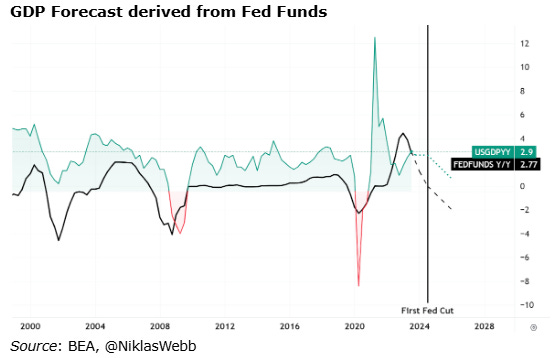
My data shows economic output and producer costs have a correlation too. As a measure of total corporate output, GDP shows a correlation with Fed Funds. Assuming no more rate hikes and cuts beginning this summer, this would correspond with GDP flat y/y heading into 2025, all else equal.
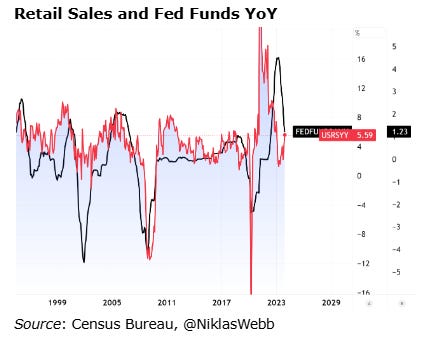
Although retail sales data doesn’t go as far as GDP, it may be in this case a better measure of cumulative economic output at least relative to Fed Funds, where it shows a strong correlation.
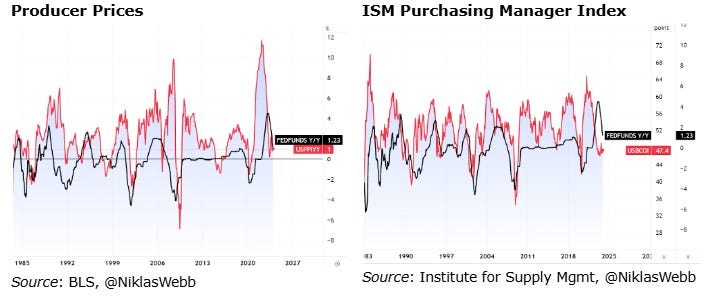
Producer costs and inventory, which are essentially substitute measures for corporate guidance, also show similar correlations, especially during rate cuts.
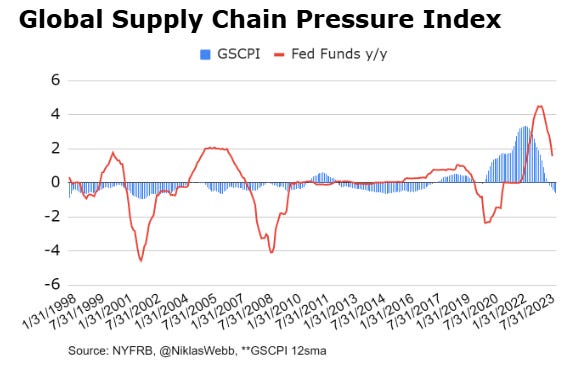
Finally, as a measure of overall supply chain health, the NY Fed’s GSCPI measures global supply chain pressure.
The good thing is data shows unlike some other points, Fed cuts are favorable. However, it’s important to remember the GSCPI is a global measure and is more influenced by the geopolitical climate than the US Fed.
FOR CONTEXT: GSCPI is calculated based on transportation costs, PMI’s, freight rates, and manufacturing prices and surveys
Sales & Profitability
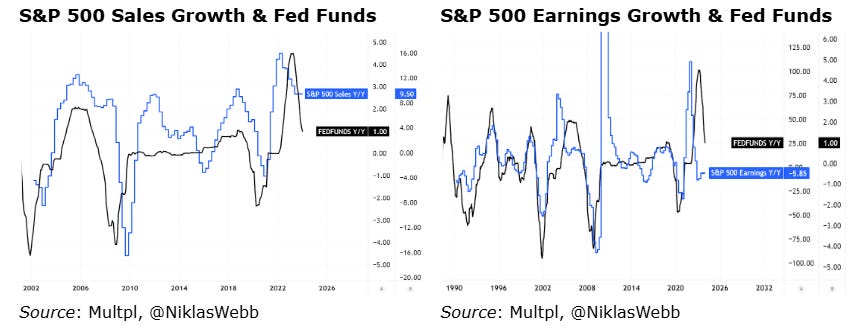
Using the S&P 500 underlying companies cumulative reporting as a measure of corporate sales and profitability, Fed cuts have a meaningful correlation with revenue. Although this data unfortunately isn’t as easily accessible, notice the sales dip in 2009 and 2002, where Fed cuts come first.
The same is true for earnings since the ‘90s, which are seemingly heavily influenced by Fed Funds.
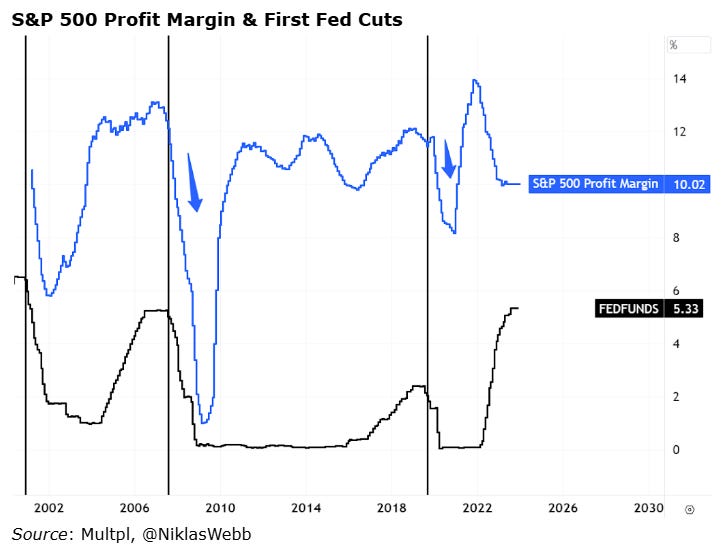
Arguably most important, there are at least three credible drops in profit margins (net, cumulative for the entire weighted index) following the first fed cuts marked by vertical lines. These are also the biggest normalized declines in the life of the data making Fed Funds possibly the biggest catalyst.
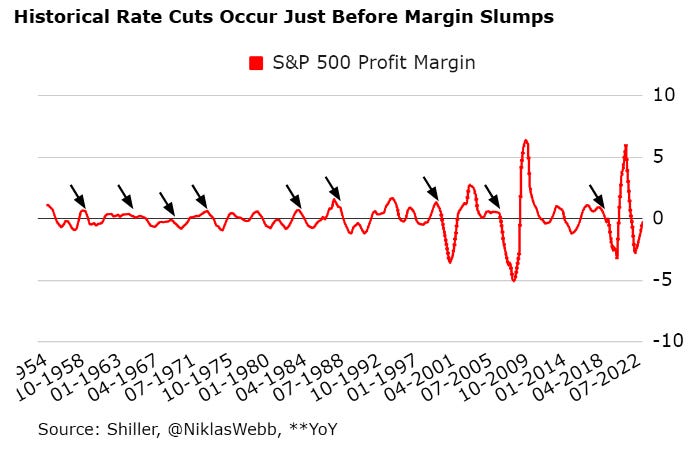
Shifting focus to average data on profit margins for the S&P 500, the longer historical data is evidence that this was not an isolated event.
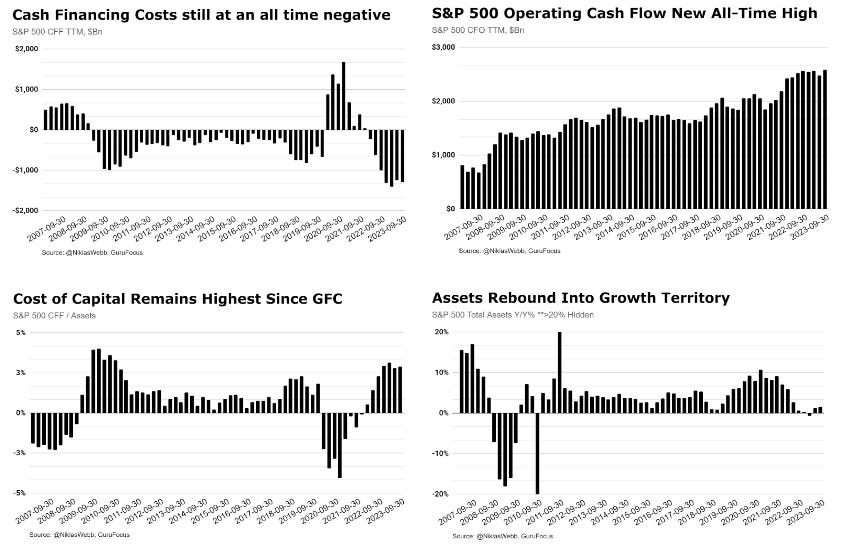
As apparent, interest rates are very meaningful to the profitability and operating leverage of companies, which indirectly drives value creation. This is most easily explained by the obvious rise in interest expense, which is passed on down the supply chain raising overall expenses and slowing spending for both companies and their customers. Reflecting back on a report I published this past July on the cost of capital, the current rate cycle is no different.
Update since…
Solvency
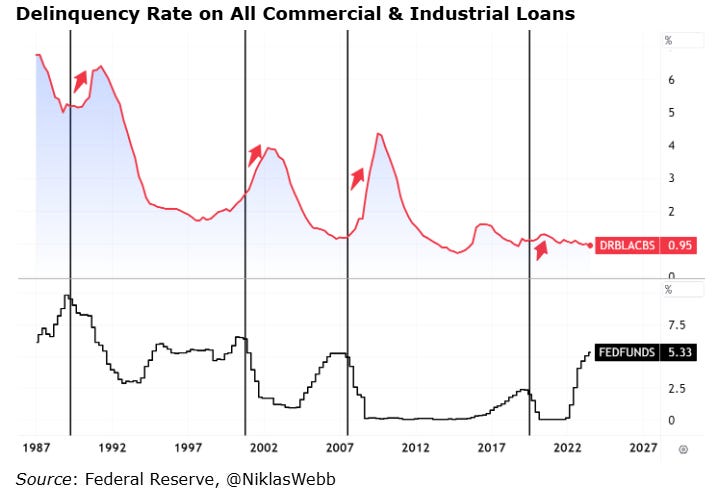
With interest rates understandable impact of profitability, my next question would be if there is a measurable impact on solvency and stability? Starting with delinquency rates on Commercial and Industrial Loans, there is a noticeable rise in delinquent loans after the first Fed Funds cut, the biggest exception being the easing during the Covid pandemic.
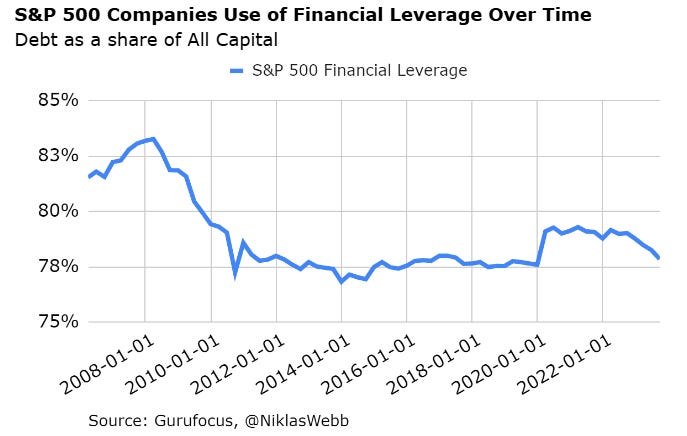
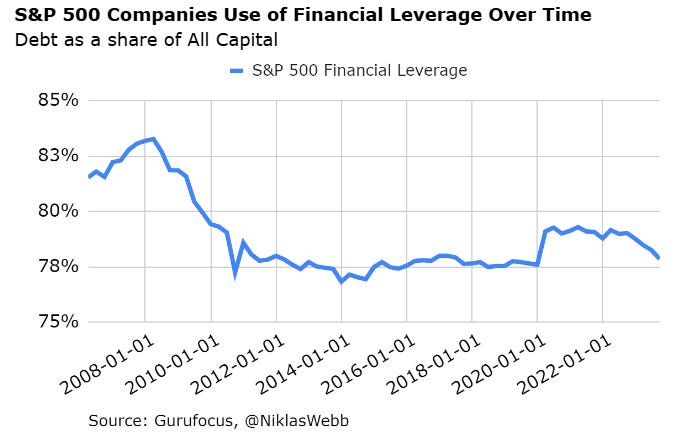
Companies tend to reduce financial leverage during economic contractions or take on less during high interest rate environments
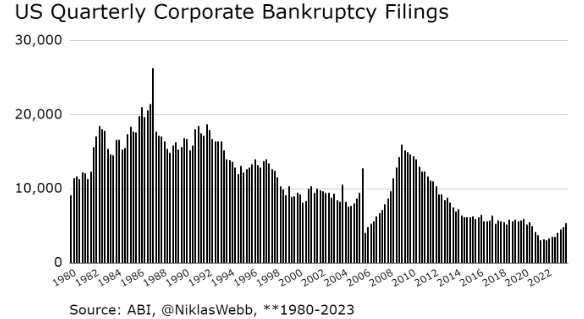
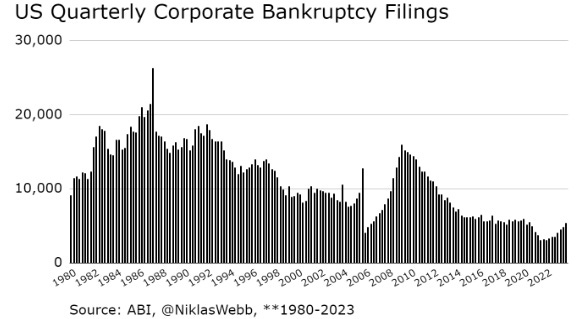
A rise in business failure rates correlate with interest rate cuts. This cycle, we’ve already seen a meaningful rise in filings earlier than any past cycle and the most of any historically. Filings increased more than 40% in 2023 from the previous year, although it should be pointed out this was coming out of the lowest number of quarterly filings in over 50 years. On the same point, accelerated filings with more than $50M in assets/liabilities reached a 13 year high this past year.
Impact on Markets
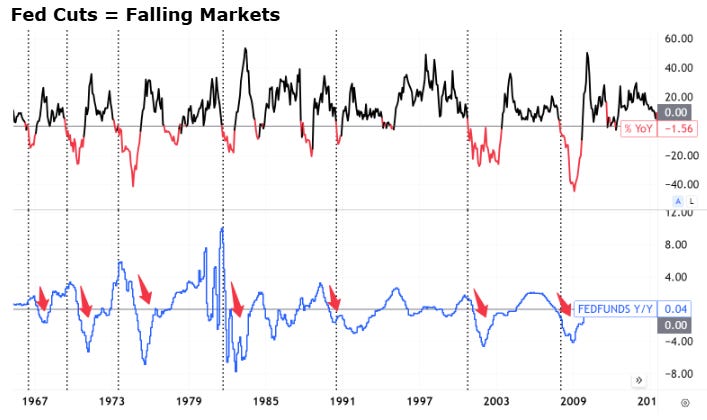
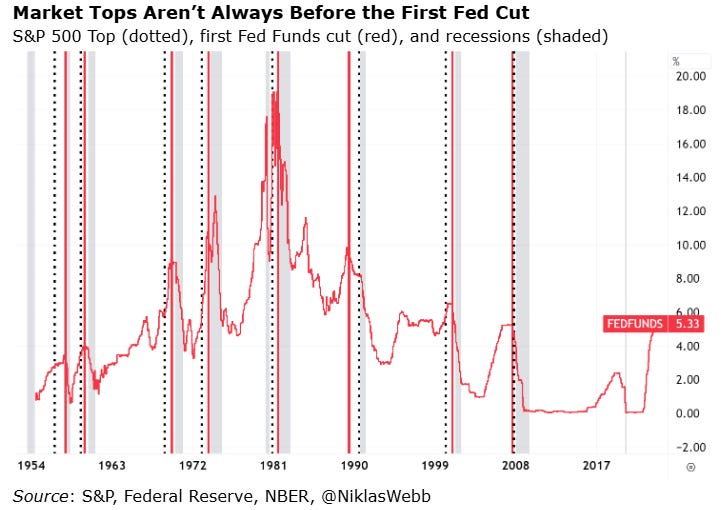
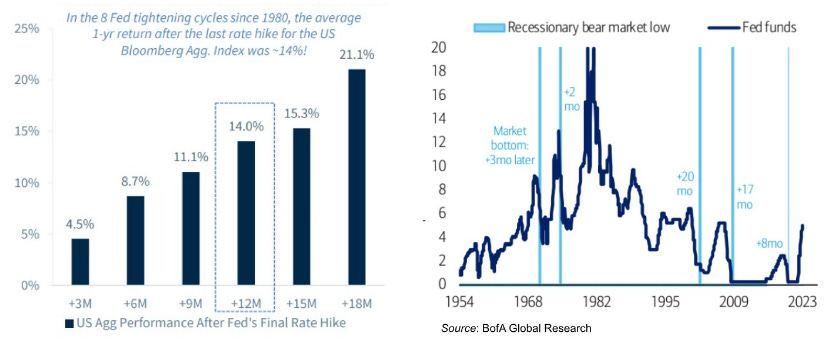
In equity markets, Fed Cuts usually precede bear markets. It’s also important to note as we just reached a new all time high on the S&P 500 index that market highs aren’t always before the first cut (two examples: 2008, 1990). History shows the average Fed induced bear market low isn’t until 10 months after the first Fed cut (since 1954), and had an average max downside from time of first cut of 25% (S&P 500 lows relative to Fed cuts - 2008 +17mos, 2000 +20mos)
Low beta assets and bonds (a low beta asset) tend to outperform during terminal rates:
DOWNLOAD THIS REPORT AS A PDF:

