BofA: No Landing Scenario
Home prices in US metropolitan areas all increase annually (Table 1),
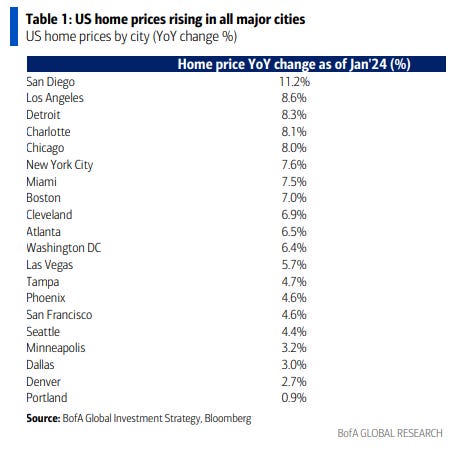
The reason for this? All-cash transactions = record 47% of all US luxury home sales in Q1
Operational?
Sell bonds until yields reach “oversold” levels of 2 standard deviations… 5.2% on 2-year bonds, 5.1% on 10-year bonds, and 5.2% on 30-year Treasuries (Chart 4).
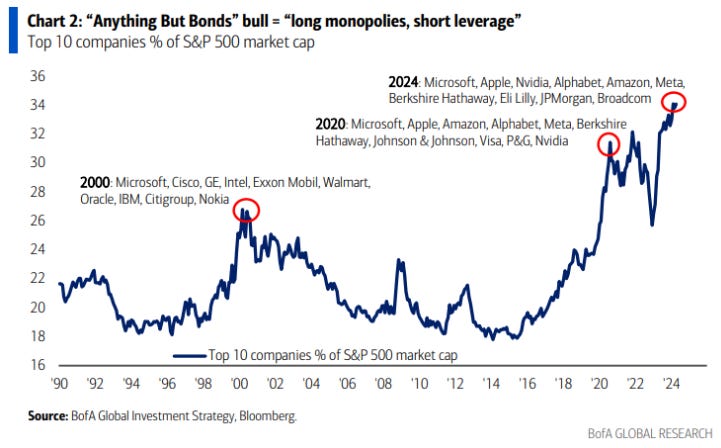
Bull ABB = “bet on monopolies, short sell leverage” in stocks; top 10 US stocks = record 34% of S&P 500 market cap (Chart 2 – “The Magnificent 7” = 30%), top 10 global stocks = record 23% of MSCI ACWI ( 2841 constituents); the narrow lead of the “growth” mega-capitals remains intact until 10-year real yields of 2½-3% and/or higher yields combine with larger credit spreads to threaten recession.
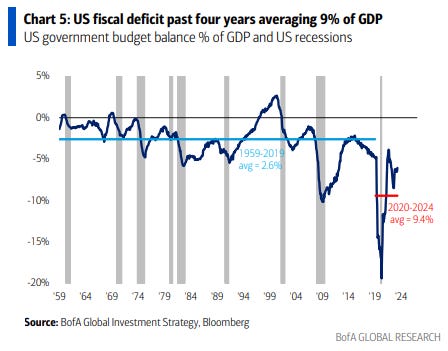
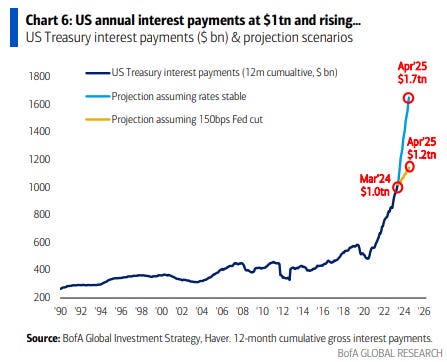
If you spent $100 every second of every day, it would take you 1,966 years to equal the $6.2 trillion the U.S. government has spent in the last 12 months; fiscal excess = non-landing = inflation = secular bear in bonds = ABB “Anything But Bonds” bull “Anything but bonds”…
Stocks and cryptocurrencies soared in the fourth quarter, commodities and cryptocurrencies soared in the first quarter, in the second quarter it is the US dollar's turn to soar as investors hedge the risk of a Fed increase and the The US government needs the strength of the US dollar to counter inflation.
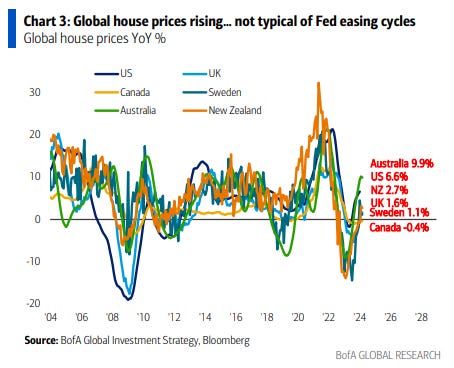
It's not something you typically see when the Fed starts cutting rates... global home prices rise (Chart 3),
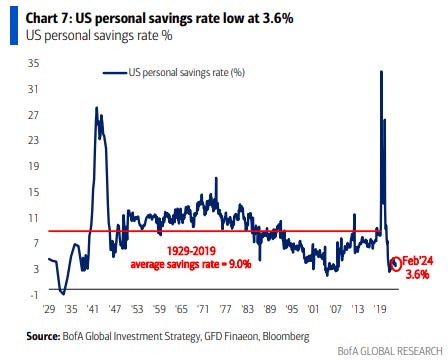
“Why save?”
2020s era of major government intervention (pandemic = “stimulus checks”, war = “energy cuts”, bank run = “insured deposits”, unaffordable housing = “student debt forgiveness”… the largest deficits ever recorded outside of recession – Charts 5-6); tax excess…
Ordinary people say “why save?”… The personal savings rate in the US is low, 3.6% (Chart 7),
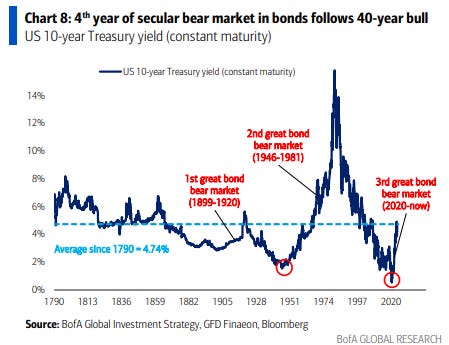
the consumer continues to spend, nominal GDP growth is up an impressive 42% since COVID… government bonds are barely four years into a secular bear market (after a 40-year secular bull – Chart 8).
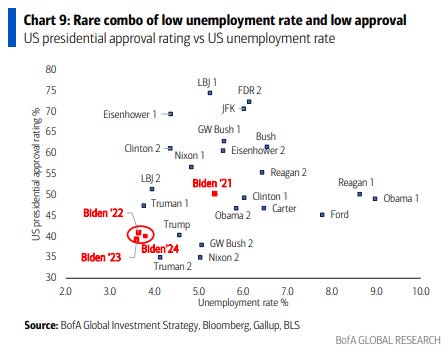
Note that the inflation of the '70s ended when electorates voted for candidates who promised to reverse inflation (note today that clearly inflation is the macro reason why Biden's approval ratings are <40% at a time of unemployment <4% – Chart 9).
“Anywhere but China” trade reverses…
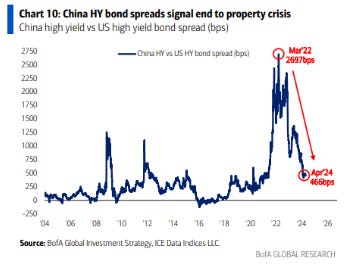
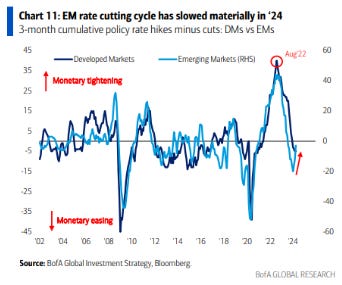
Chinese stocks soar due to valuation, positioning (the world “bets on emerging markets except China, shorts China”), China's high-yield bond spreads indicate that there is no real estate crisis (Chart 10); plus… higher UST yields + stronger US dollar = problems in emerging markets… pace of rate cuts by EM central banks slower (Chart 11 – some revert to increases due to inflation and FX weakness, for example, Indonesia); China is one of the best performing bond markets so far this year… China less vulnerable to EM crisis assuming no Japanese yen collapse.
Flows to Know:
Treasurys: first outflow in three months ($1.6 billion),
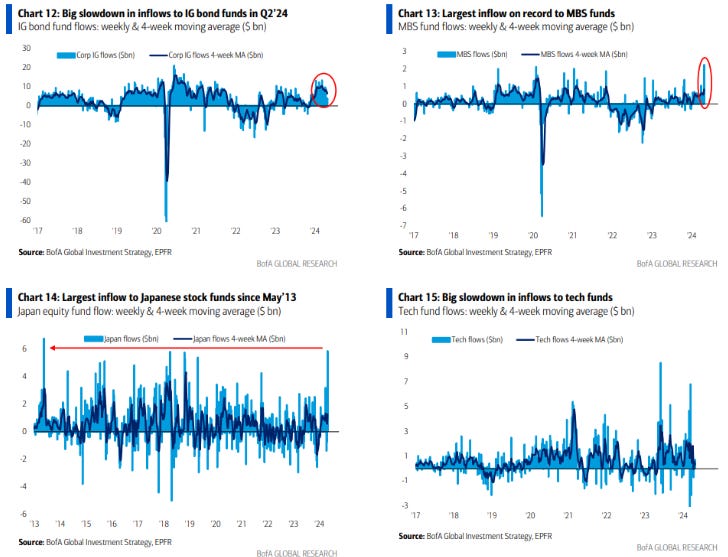
IG Bonds: the lowest income to date of the year ($3.9 billion – Chart 12),
MBS: record weekly income ($2.2 billion – Chart 13),
Japan: highest income ($5.9 billion – Chart 14) since May 2013 (BoJ QQE announcement),
Technology: small revenue of $0.7 billion (like IGs, revenue has decreased – Chart 15),
Consumer: Largest outflow since February 2022 ($1.1 billion).
“Why sell short?”
Last 20 years of heavy Fed intervention and monetary excess (QE, ZIRP, NIRP…)… Wall Street says “why short sell?”… The “Fed put” has given rise to secular credit bull markets and stocks (both now late in the cycle); the Fed “turn” in Q4 spurred huge inflation in asset prices, which ironically makes it harder to deliver the “turn” in '24... the bull market in the US dollar and gold/crypto reflects a bear market in institutional confidence.
“Why save?” + “Why sell short?”
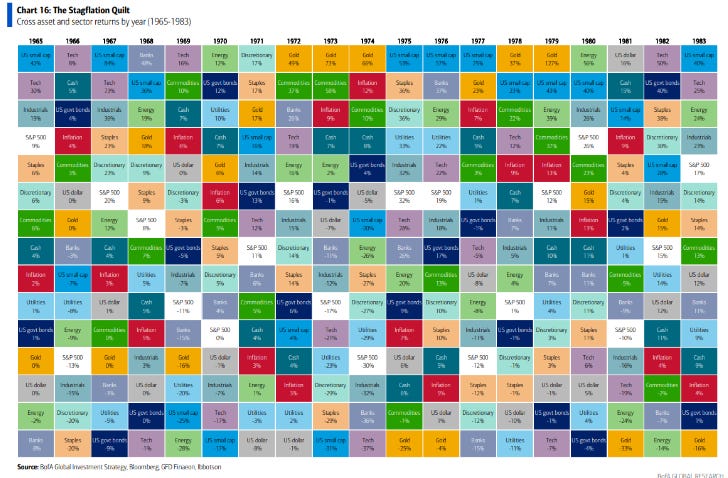
…inflation on Wall Street and Main Street in 2024…no landing is much more likely than a soft landing; a “good” non-landing driven by growth acceleration (e.g. global PMIs) is a positive risk, especially for cyclicals (this is how the market is positioned); but a “bad” non-landing driven by accelerating inflation represents more negative risk, positive volatility and real assets (e.g. cash, gold and commodities – see “Stagflation Quilt” Chart 16);
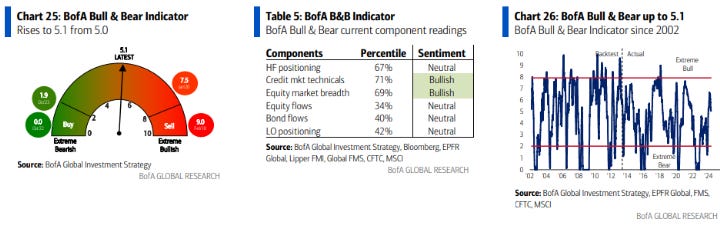
BofA Bull&Bear Indicator
Up to 5.1 from 5.0, driven by reduction of short positions in HF SPX, resilient credit techniques and lower levels of FMS cash (4.2% in April), offsetting emerging market debt outflows and global equity outflows.