BofA: Hartnett Comments (01/18/2025)
The Right Price:
Since the Fed’s 50bp rate cut in September, the worst performing assets have been bonds (Treasury yields up >100bp) and rate-sensitive sectors (such as homebuilding stocks, a clear example of “sell on the first cut”). We think Trump’s need for “smaller government” equates to a “twin peak” in bond yields at 5%. We prefer bond duration and rate-sensitive sectors, such as XHB, UTIL, XLF, and XBI.
Zeitgeist:
“20-year corporate bonds now yield 6.3%… you might think that with stocks up 20% over the past 2 years, pension funds would be looking to park some of those gains in bonds.”
The Big Picture:
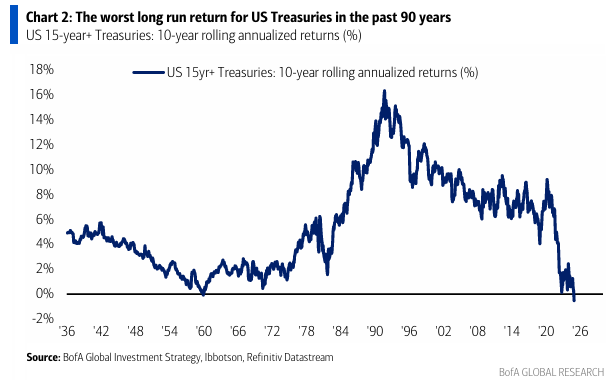
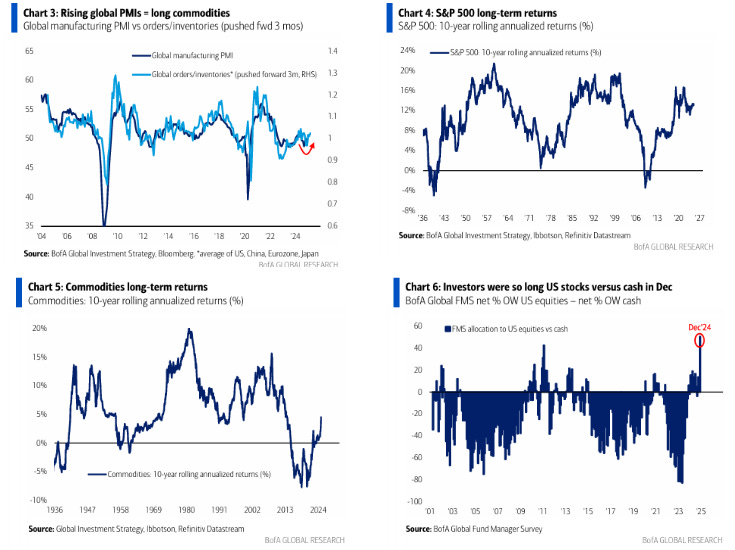
In the past 90 years, 10-year cumulative yields on U.S. Treasury bonds have never been negative. Now they are (-0.5%, Chart 2). This is the peak of the “anything but bonds” trade of the 2020s. By comparison, long-term yields are: U.S. stocks, 13.1%; commodities, 4.5%; investment-grade bonds, 2.4%; and Treasury bills, 1.8% (Charts 4-5).
Positioning:
The December 2024 Fund Manager Survey ( FMS ) reflected a record underweight in cash and a record overweight in US equities (Chart 8), coinciding (17 December) with a short-term peak in risk assets. For the January FMS (published on 21 January), it is recommended to watch the following indicators to confirm whether the end-of-year over-optimism has abated and whether sentiment towards risk assets becomes more moderate:
FMS Cash Levels : If they rise from the current 3.9% to above 4.0%, the sell signal would end as per BofA's Global FMS trading rule.
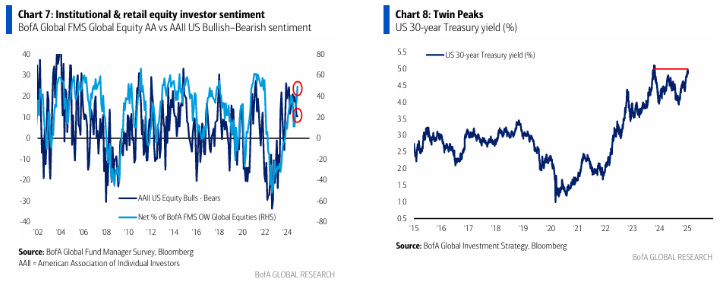
FMS equity allocation : If it falls from 49% overweight (the most optimistic since January 2022) to less than 25%, it would confirm that institutional sentiment towards equities is following the decline in retail equity optimism, as measured by the AAII index (Chart 7).
Bonds and Shares:
Bonds:
The 30-year Treasury yield has not breached 5% (twin peaks, Chart 8), and 2.5% on 10-year real rates has not been breached either.
Fed rate cuts through 2025 have been priced out of the market, and Trump can't afford bigger deficits and debt.
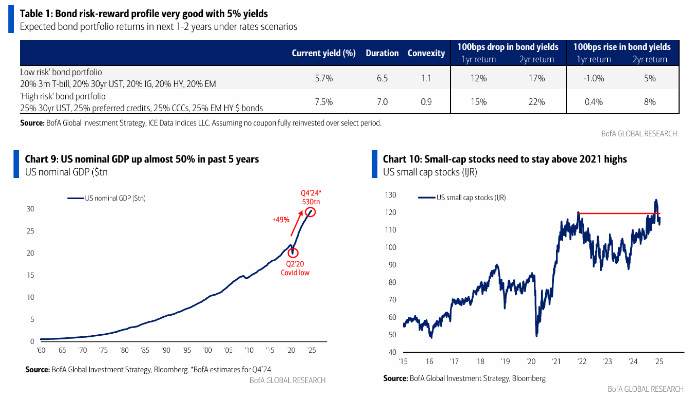
The US government, at $7.3 trillion, is the world’s third-largest economy and the biggest driver of the 50% increase in US nominal GDP over the past 5 years (Chart 9), but it will not grow in 2025.
The Fed is more serious about inflation, and Trump is more serious about deficits, so investors will likely need to reduce their underweight in bonds.
Potential Returns on Bonds:
A “low risk” bond portfolio (20% Treasury Bills, 20% 30-year Treasuries, 20% Investment Grade, 20% High Yield, 20% Emerging Markets) could generate a return of 11-12% if yields fall towards 4%.
A “higher risk” portfolio (25% 30-year Treasury, 25% Senior Credit, 25% CCC, 25% Emerging Markets High Yield) could achieve returns of 14-15% under the same scenario (Table 1).
Actions:
a. The US index is protected on the downside by Trump, but has limited upside potential due to concentration, valuation and positioning.
b. If yields peak and Trump 2.0 fails to propel small caps (IJR) above 2021 highs (Chart 10), asset allocators will likely reduce their overweights in equities.
c. It is recommended to buy rate-sensitive sectors (XHB, XLU, XLF, REIT) in a “Twin Peaks” yield scenario.
d. For 2025, we prefer long positions in international markets (Europe/China/Emerging Markets) due to easing policies, cheap currencies, attractive valuations and a more peaceful geopolitical environment (Russia/Ukraine and the Middle East). The best decades for European stocks were the 1950s after World War II and the Marshall Plan, and the 1980s with the fall of the Soviet Union and the Berlin Wall.
Market Story:
Since the Fed's 50 basis point rate cut in September, the best performing asset has been commodities (up 10%). Stay long commodities on rising global PMIs (Chart 3), growing money supply in China and a peak US dollar. However, shift to long gold versus oil as geopolitical tensions between Russia, Ukraine and the Middle East shift from war to peace.
Flows to Take into Account:
Cash: largest outflow since April 2024 ($83.5 billion).
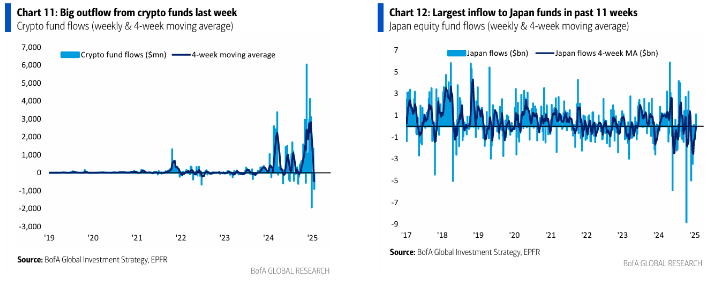
Crypto: significant outflow of $0.9 billion (Chart 11).
Bank loans: remarkable inflow of $2.1 billion (longest streak of inflows since December 2021).
Europe: 16th consecutive week of outflows ($0.7 billion).
Japan: Highest inflow in the past 11 weeks ($1.1 billion – Chart 12).
BofA Bull & Bear Indicator:
Up to 3.8 from 3.6 on broader breadth in global equity indices, strong technicals in the credit market and low cash levels of 3.9% according to the Fund Manager Survey (FMS).


