


BofA: Fund Manager Survey (10/15/2024)
October FMS shows record monthly reduction in bond allocation Monthly change in FMS net bonus allocation percentage.

Our broadest measure of FMS sentiment, based on cash levels, equity allocation and economic growth expectations, rose to 5.6 from 3.8, its largest monthly increase since June 2020.

The cash level in the FMS fell from 4.2% to 3.9%, its lowest level since February 2021.
With the FMS cash level below 4.0%, the BofA Global FMS Cash Rule triggered its first contrarian “sell” signal since June 2024. Since 2011, there have been 11 prior “sell” signals resulting in global equity returns (ACWI) of -2.5% in the subsequent month and -0.8% in the three months after the “sell” signal was triggered.

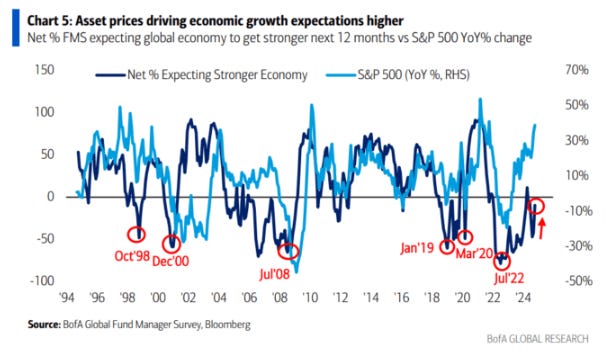
Global growth expectations rose from -47% to -10%… the fifth-largest jump since 1994 (after January 2002, November 2019, April 2020, and May 2020), driven by a 50bp Fed cut, a 250k payrolls increase, and stimulus in China (equivalent to 3% of GDP).

Asset prices are pushing up expectations for economic growth.
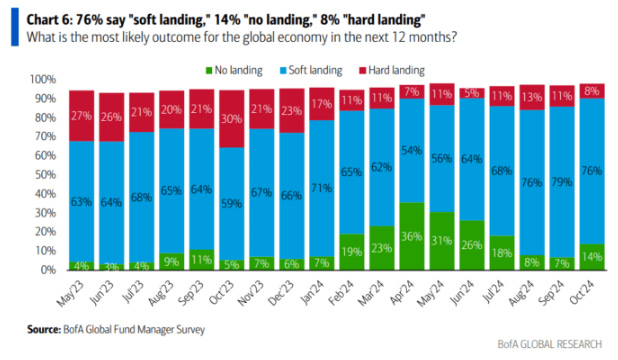
On landings… The probability that FMS investors assign to a “soft landing” is 76%, while the leading alternative scenario is now “no landing” at 14% (up from 7%), followed by “hard landing” at 8% (falling to a 4-month low).
85% of FMS investors expect yield curves to steepen by 2025, close to the record 90% reached in the September survey.

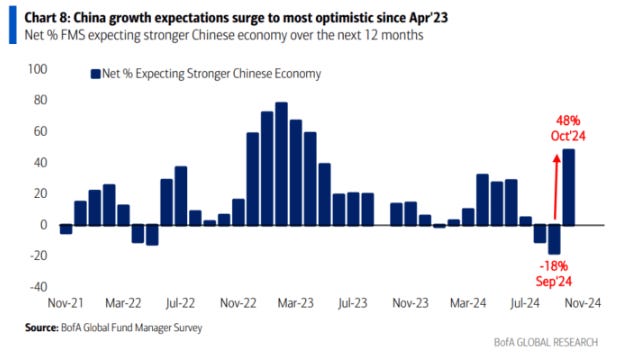
China's stimulus announcement prompted investors to raise their outlook on Chinese growth, with a net 48% expecting a stronger economy (the most optimistic level since April 2023).
When asked about the biggest “winner” from China’s stimulus announcements, FMS investors pointed to emerging market stocks (47%) and commodities (41%).

Government bonds (41%) and Japanese stocks (33%) are seen as the biggest “losers” following the stimulus announcements in China.

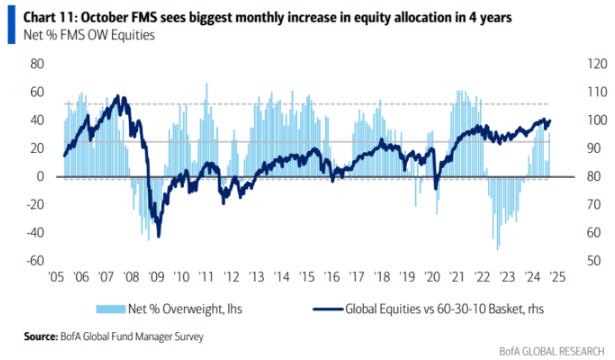
In October, FMS investors increased their allocation to equities by the largest amount since June 2020. A net 31% of FMS investors are overweight equities, compared with a net 11% overweight last month.
When asked about the distribution within their bond allocations, a net 18% of FMS investors are underweight government bonds, while a net 32% are overweight corporate bonds.

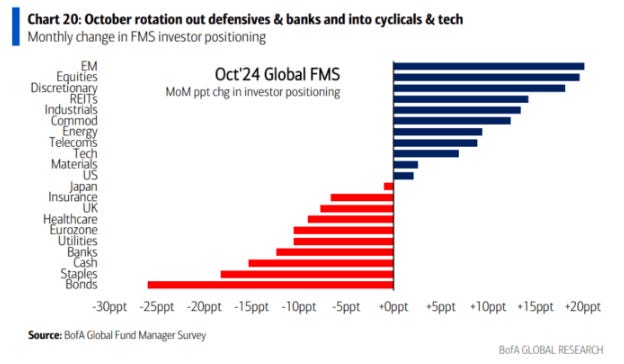
Within sectors, FMS investors reduced their exposure to defensive sectors (e.g., consumer staples, utilities) and rotated into cyclicals (e.g., consumer discretionary, industrials, and energy).
Allocation to consumer staples fell at the fastest pace since 2005, while allocation to consumer discretionary saw the largest monthly increase on record since 2005.
On a relative basis, investors are underweight consumer staples versus consumer discretionary at the highest level since December 2021.

As for tail risks… 33% of FMS investors see geopolitical conflict as the top ‘tail risk’, up from 19% last month.
Worries about accelerating inflation continued to rise, from 18% to 26%, while concerns about a US recession eased to 19% (from 40%, when it was the top risk in September).

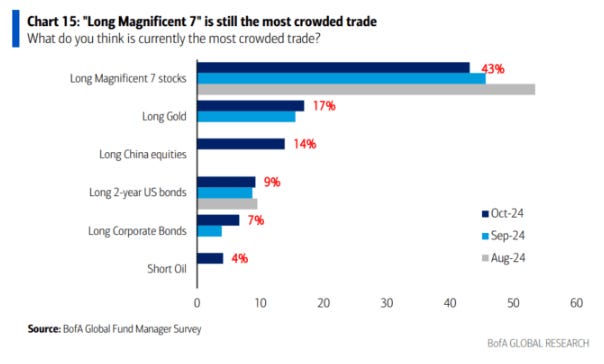
As for crowded trades… “Long Magnificent 7” continues to hold the top spot as the most crowded trade for 19 consecutive months at 43% (down from 71% in July 2024). 17% of investors say “long gold” and 14% say “long Chinese stocks” are the most crowded trades.
52% of FMS investors said they expect normal hedging activity in the weeks leading up to the US election in November. 25% said hedging activity will likely be “somewhat higher than normal” in the run-up to the election.

Asked about the impact of a U.S. election “sweep” — where the same party wins the White House and Congress — 47% see the outcome as negative for the S&P 500, while 28% see it as positive for stocks.

66% of investors believe a sweeping election result would result in higher bond yields, while only 12% expect lower yields.

Investors are somewhat divided on the impact of an election “sweep” on the US dollar, with 43% expecting a stronger dollar, while 35% expect a weaker dollar.

This chart shows monthly changes in FMS investors’ allocation for October.
Investors increased their allocation to emerging markets, equities, cyclical sectors (consumer discretionary, industrials, energy) and REITs…
…and decreased their allocation to bonds, cash and defensive sectors (bonds, utilities).
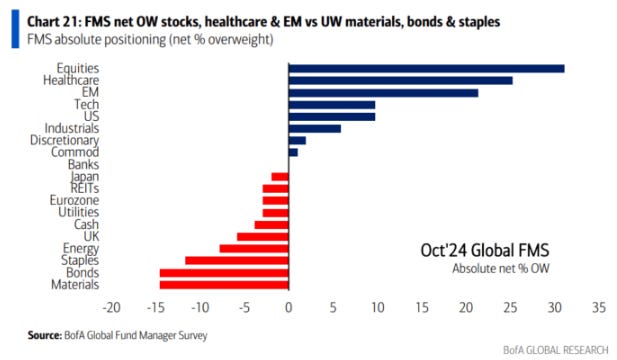
This chart shows the absolute positioning of FMS investors (net overweight percentage).
Investors are most overweight in equities, healthcare and emerging markets, while most underweight in materials, bonds and consumer staples.
This chart shows the positioning of FMS investors relative to the long-term average positioning (roughly over the past 20 years).
Compared to history, investors are long utilities, bonds, telecoms, and UK and US equities…
…and are underweight cash, resources (energy and materials), technology, and the Eurozone.
