BofA: Fifty Shades of Decay (09/05/2024)
Scores on the Doors: gold 21.7%, stocks 13.8%, crypto 7.0%, HY bonds 6.9%, IG bonds 4.4%, cash 3.7%, govt bonds 1.4%, commodities -0.1%, US dollar -0.3%, oil -3.4% YTD.
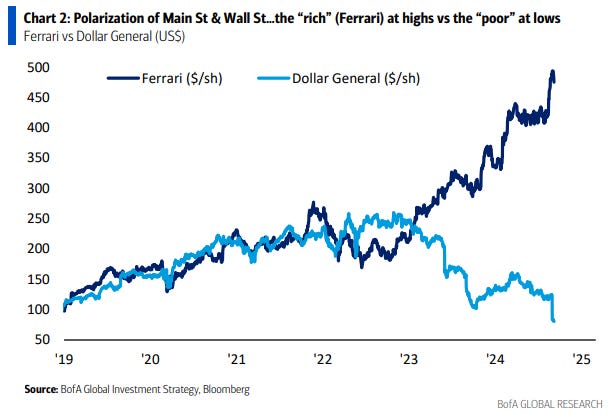
The Biggest Picture: the “rich” e.g. Ferrari at all-time high vs the “poor” e.g. Dollar General at 6-year low (Chart 2); “polarization” of Main St & Wall St (c/o $15tn market cap of monopolistic “Magnificent 7” vs $18tn market cap of 4846 companies in MSCI DM small & mid cap indices); “polarization” big reason that “market fragility” all the rage.
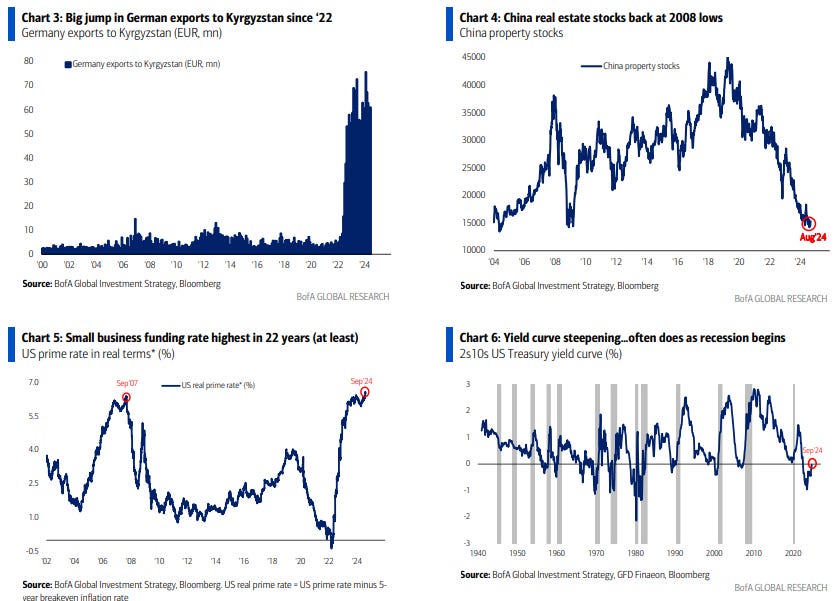
Tale of the Tape: FX screaming “here comes 50bps cut”…Yen longs at 3½ year highs, Euro longs at 9-month highs…this despite BoJ policy rate at 0.25%, political dysfunction in France/Germany; German GDP unchanged since 2018 & exporters desperate (see Kyrgyzstan – Chart 3), Volkswagen closing factories in Germany 1st time since 1938…only reason all want to short US$ is belief Fed about to start slashing rates.
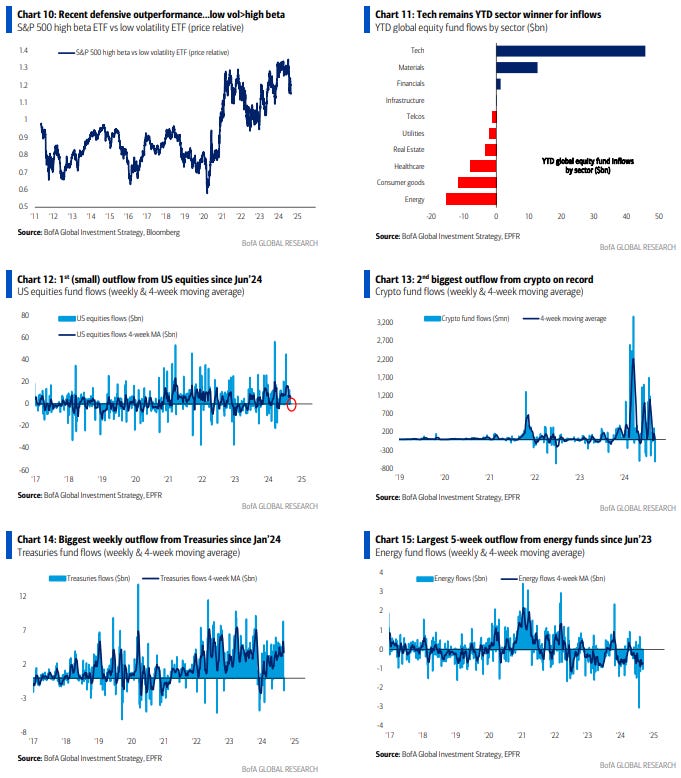
The Price is Right: Aug payrolls <100k + U-rate >4.4% = hard landing = 50bps Fed cut = sell-the-rip as GT10 heading toward 3%, oil $60/bl, JPY 135, EUR 1.15, SOX 4k; in contrast, perfect payroll = 150-175k + tame <0.1% AHE = soft landing = tech & energy lead reversal of recent big defensive outperformance (e.g 15-month high UTIL vs TRAN, 10-month high low vol stocks vs high beta – Chart 10).
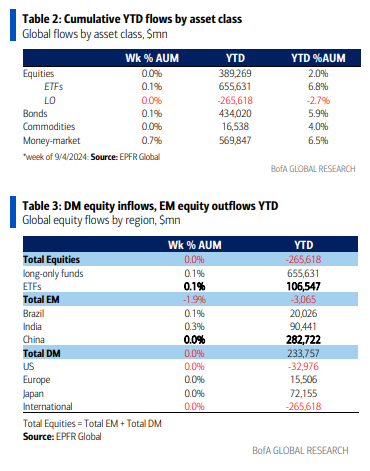
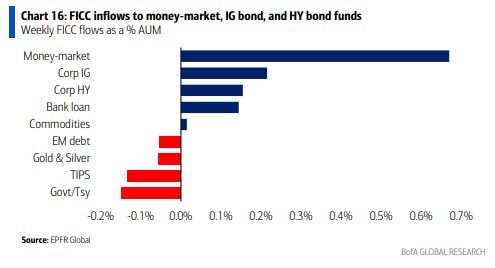
Weekly Flows: $60.8bn to cash, $9.5bn to bonds, $3.0bn to stocks, $0.6bn to gold, $0.6bn from crypto.
Flows to Know:
Cash: largest 5-week inflow ($231bn) since Dec’23;
Crypto: 2nd largest weekly outflow ($0.6bn) on record (Chart 13);
Treasuries: biggest weekly outflow ($1.9bn – Chart 14) since Jan’24;
US equities: 1st weekly outflow since Jun’24 (albeit teeny $20mn & tech remains #1 sector YTD – Charts 11 &12);
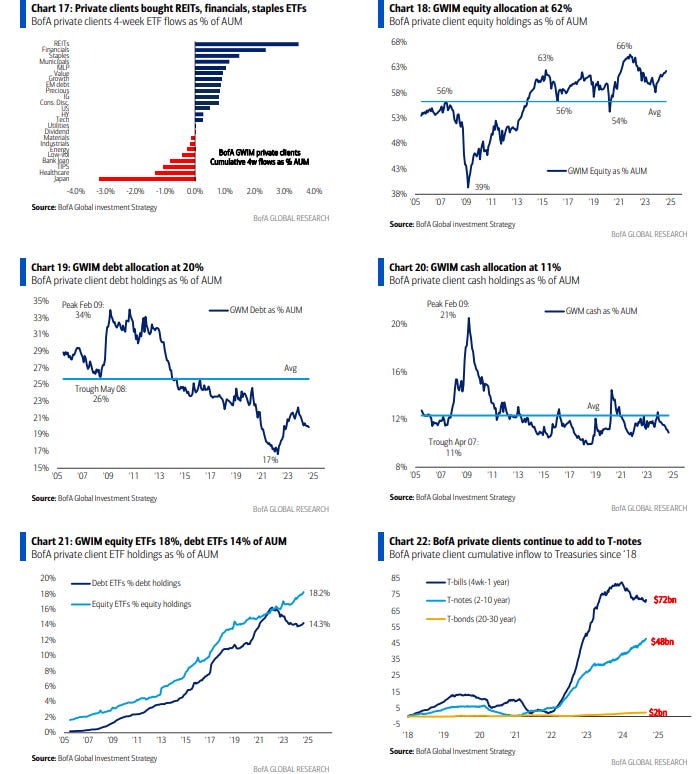
Energy: largest 5-week outflow ($3.9bn – Chart 15) since Jun’23. BofA Private Clients: $3.7tn AUM…62.4% in stocks, 19.9% bonds, 10.9% cash;
BofA private clients selling stocks, buying bonds (biggest weekly inflow since May’24); in ETFs private clients buying REITs, financials, staples, and selling Japan, healthcare, TIPS in past 4 weeks.
BofA Bull & Bear Indicator: dips to 5.9 from 6.2 as weaker equity breadth + higher SPX & US$ hedging activity offsets stronger inflows to equities & bonds.
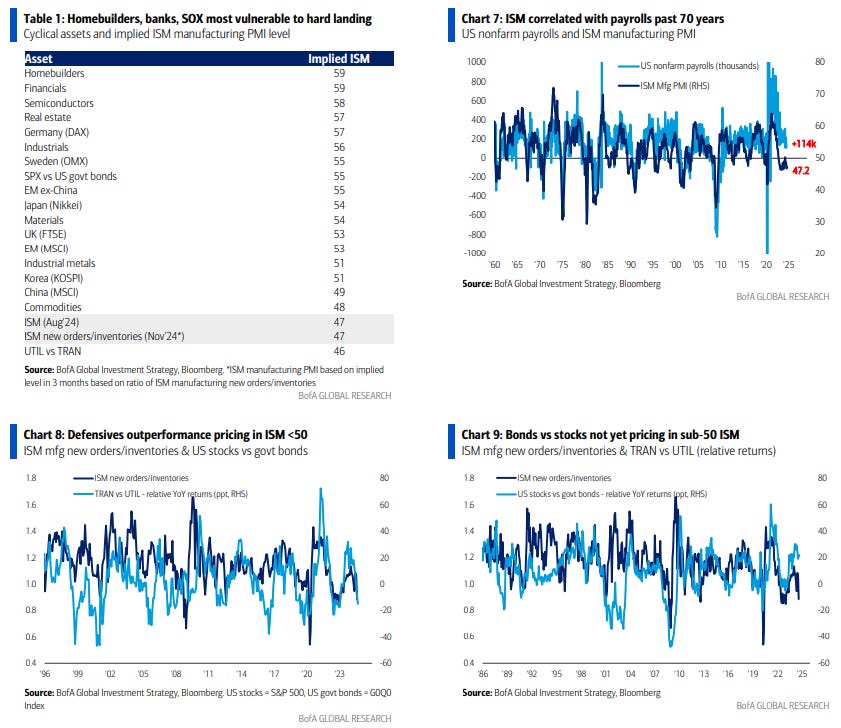
Our Themes & Trades: we say a. hard landing probability underpriced by consensus (13% acc to last BofA Global FMS vs 76% probability of soft landing), b. “sell the 1st rate cut” (risk assets have aggressively front-run Fed/less focused on lower growth – see The Flow Show: Old School Risk-Off 01 August 2024), c. we are bullish 3Bs of Bonds, Bullion, Breadth (via equity “defensives”)…these are the H2 “buy-the-dip” plays; d. cyclical homebuilders, banks, semiconductors most vulnerable to “hard landing” (Table 1), commodities, EM & China least vulnerable; e. best global opportunities in real estate/banks in UK, Canada, Australia, NZ, Sweden, all floating mortgage rate markets where transmission mechanism from rates to animal spirits much quicker than in US.
On Profits & Policy: not all doom & gloom but data challenging soft landing…yield curve steepening hard (often does as recession begins – Chart 6); leading inventory-sales ratio says ISM <50 rest of year, defensives outperformance pricing in ISM <50 (bonds vs stocks not yet – Charts 8 & 9); ISM correlated with payrolls past 70 years (Chart 7); labor data (JOLTS, ADP, 990k of downward payroll revisions) weaker; no sign lower rates helping US housing (mortgage apps for purchase pinned to lows); and rest-of-world led by China ain’t growing…note China bond yields hitting new all-time lows as China real estate & small cap stocks back at 2008 lows (Chart 4); we say Fed cuts aggressively, “sell the 1st cut”, wait for better entry to risk assets because a. fiscal stimulus reversing…US government spending -5% on 12-month rolling basis; b. real rates now punishing US small business sector in particular…note US prime rate in real terms = 6.5% = highest this century (Chart 5).


